
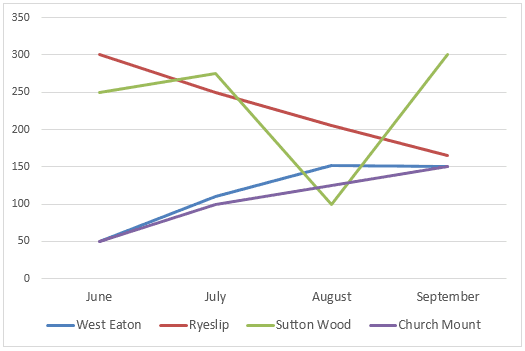
The line graph shows the
number
of Use synonyms
books
obtained from four village libraries for four months, Use synonyms
while
the pie chart gives data regarding the kinds of Linking Words
books
borrowed including self-help, fiction, history, science and biography.
Use synonyms
Overall
, it can be clearly seen that the Linking Words
number
of Use synonyms
books
borrowed from West Eaton and Church Mount was the same in June and September. Use synonyms
Additionally
, fiction Linking Words
books
were the most popular.
Looking into details, the Use synonyms
number
of Use synonyms
books
borrowed from West Eaton and Church Mount observed similar and upward trends, starting with 50 and ending with 150. The figure for Sutton Wood underwent a fluctuation. The count was 250 in June. It reached a peak of 300 in September, Use synonyms
although
the figure declined to 100 in August. Ryeslip Library gave people 300 Linking Words
books
at the beginning of the period, Use synonyms
then
the Linking Words
number
of Use synonyms
books
decreased to just below 200 in September.
Turning to the pie chart, the most prevalent section was fiction, accounting for 43%. 19% of people who borrowed Use synonyms
books
from libraries preferred biographies. The percentages of self-help and history Use synonyms
books
were the same rate, making up 14%.Use synonyms