
The pie charts indicate the proportion of several ingredients that are being used in regular dishes, which might have negative impacts on the population's hygiene status.
Overall
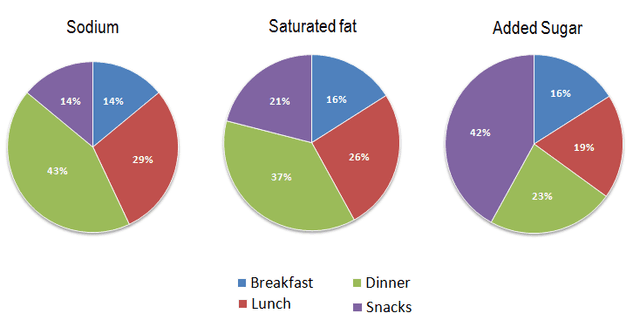
, the majority of these materials are included in dinner meals Linking Words
while
for sugar a significant percentage could be found in Linking Words
snacks
.
Use synonyms
To begin
with, Sodidum has the highest figure for dinner at 43% and the lowest amount of Linking Words
this
ingredient is equal in both breakfast and Linking Words
snacks
at 14%, Use synonyms
additionally
, the second order of Linking Words
this
type is captured by lunch at 26%.
Saturated fat has a dramatic proportion in dinner meals Linking Words
while
the lowest amount that measured is in mornings dishes at 16% , Linking Words
furthermore
, the afternoon food has 26 per cent of Linking Words
this
figure and with a slight reduction the Linking Words
snacks
stay in third place by 21%.
Use synonyms
Lastly
, the extra sweets Linking Words
has
a noticeable amount in Change the verb form
have
snacks
with 42% which is the highest percentage among other meals,Use synonyms
moreover
, at night serves Linking Words
this
figure measured at 23% and for two other serves lunch and breakfast remained at 19% and 16% respectively.Linking Words