The chart below shows tha value of one country's exports in various catagories during 2015 and 2016. The table shows the percentage change in each catagory of exports in 2016 compared with 2015 Summarise the information by selecting and reporting main features, and make comparisons where relavant.

The chart below shows tha value of one country's exports in various catagories during 2015 and 2016. The table shows the percentage change in each catagory of exports in 2016 compared with 2015

Summarise the information by selecting and reporting main features, and make comparisons where relavant.
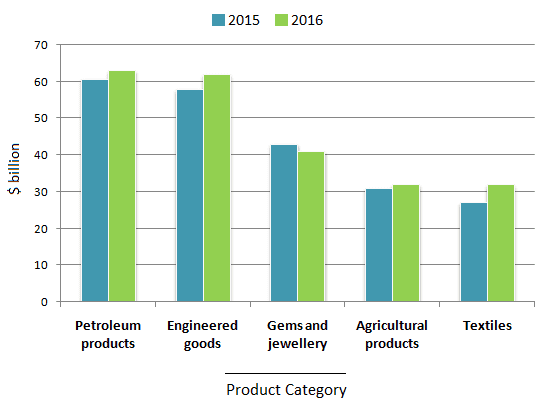
The bar chart represents the amount of income from a variety of exported goods and the table illustrates the change of proportion in each product between 2015 and 2016. The unit on the Y-axis is shown in billion dollars.
Overall
,
it is clear that
petroleum is the main resource of earnings and textiles make the least in both years.
However
, the textiles percentage rises the most compared to others.
To begin
with, earnings in the country mostly came from petroleum products, at 60 and 63 respectively. Followed by engineering parts which was about 57 in 2015 and almost the same number as in oil products, at 62, in 2016. Agricultural income had a small gap between both years, by 1%.
Additionally
, Textiles made only 25 in 2015 but it surged to 32 in 2016.
Moreover
, the fabric rate increased the most from 2015 to 2016 by 15.24%
while
engineering parts came the second place, rising by 8.5%. The increase in oil and agricultural products was 3% and under 1%.
Although
every product's earnings jumped up, gems and jewellery were down by 5.18%.
Submitted by nnatthinee on

Unauthorized use and/or duplication of this material without express and written permission from this site’s author and/or owner is strictly prohibited. Excerpts and links may be used, provided that full and clear credit is given to Writing9 with appropriate and specific direction to the original content.

Vocabulary: The word "increased" was used 2 times.
Topic Vocabulary:
  • export categories
  • percentage change
  • value
  • economic indicators
  • manufactured goods
  • commodities
  • trade balance
  • fluctuations
  • economic conditions
  • domestic production
  • trade policies
  • year-over-year comparison
  • significant increase/decrease
  • trends
  • global market
  • comparison
  • economic implications
  • patterns
What to do next:
Look at other essays: