
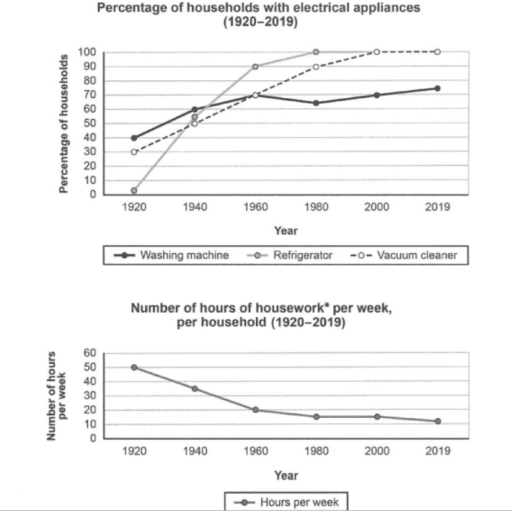
Two line graphs give statistics about households in terms of the ratio of households with electric devices (washing machine, refrigerator, and vacuum cleaner) and the total
hours
spent on doing housework per week from 1920 to 2019. Use synonyms
Overall
, two main features can be observedLinking Words
:
Punctuation problem
:
first,
the total number of all devices has increased and Linking Words
second,
Linking Words
hours
spent on doing chores Use synonyms
has
declined, showing that people started doing less housework, as the total number of gadgets rose.
As the graph shows, practically nobody had refrigerators in 1920, it being 0%, and Correct subject-verb agreement
have
this
figure has witnessed a rapid growth to 100% in 1980. Linking Words
Furthermore
, it had remained the same till 2019, practically all families having at least one refrigerator. Linking Words
In contrast
, only 40% of families had a washing machine in 1920, following a steady rise to 70% in 2019. There was a vacuum cleaner in one in three households in the community in 1920. Linking Words
This
figure experienced a rise to around 75% in 2019. In terms of Linking Words
hours
spent doing chores, about 50 Use synonyms
hours
and 10 Use synonyms
hours
were spent on Use synonyms
doing
housework in 1920 and 2019, respectively.Verb problem
apply