The chart below shows the percentage of people born in and outside of Australia living in cities, and towns, and Ural areas in 1950 and 2010. Summurise the information by selecting and reporting the main features of the graph and make comparison where relevant.

The chart below shows the percentage of people born in and outside of Australia living in cities, and towns, and Ural areas in 1950 and 2010. Summurise the information by selecting and reporting the main features of the graph and make comparison where relevant.
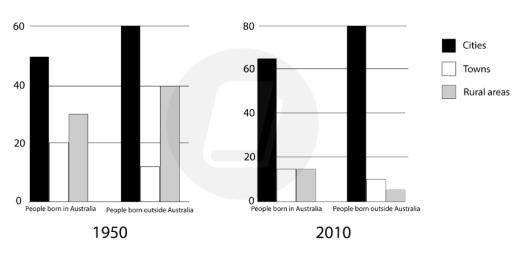
The bar graphs give information about the number of born people throughout
Australia
from 1950 to 2010.
Overall
,
it is clear that
the percentage of being born in the
cities
of
Australia
showed a similar rising trend in both given periods,
while
2010 witnessed the smallest. In 1950, More babies were born in all selected places, namely,
cities
, towns and rural places of
Australia
than in 2010. That of
cities
inside of
Australia
was about at 50% in 1950 and other figures: towns and the countries had 20% and nearly 30 %respectively,
while
that year more people had babies outside of that. the year 2010 was a dominant year for the trend of being born in
cities
of the country inside and outside,
however
, there was a decrease in the born schedule in towns and suburbs.
Submitted by hamzayevasamina on

Unauthorized use and/or duplication of this material without express and written permission from this site’s author and/or owner is strictly prohibited. Excerpts and links may be used, provided that full and clear credit is given to Writing9 with appropriate and specific direction to the original content.

Linking words: Don't use the same linking words: "while".
Common mistake: Your writing should be 150-250 words.
Vocabulary: Replace the words australia, cities with synonyms.
Vocabulary: The word "give" was used 2 times.
Vocabulary: The word "trend" was used 2 times.
Vocabulary: The word "about" was used 2 times.
What to do next:
Look at other essays: