
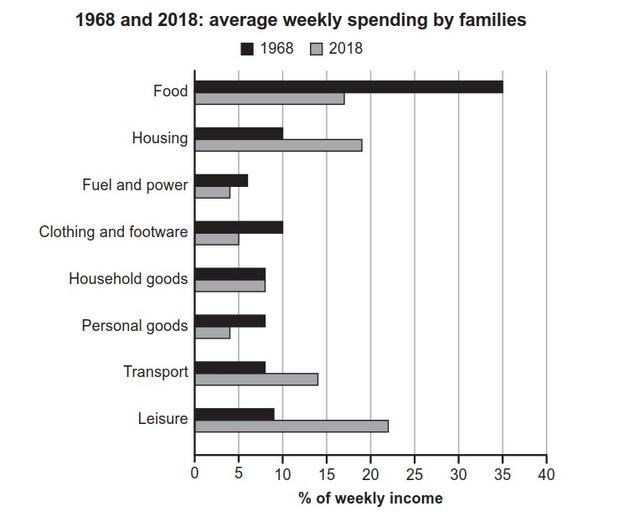
The bar chart provides the breakdown of different types of weekly expenditure by families in one country in 1968 and in 2018.
Overall
, Linking Words
it is clear that
in 1968, the highest amount of spending went for food, three times as high as the second highest option; Linking Words
however
, in 2018, leisure is on top of the list. Notably, families tended to spend the least proportion of their income on fuel and power throughout the period shown.
In 1968, families spent %30 of their wages on food, making it far higher than housing and clothing and footwear at %10. Other options, Linking Words
such
as leisure, transport, personal Linking Words
goods
, and household Use synonyms
goods
, had roughly the same amount, accounting for %7 or %8 of their weekly income.
In 2018, leisure made up the majority of the proportions at about %22, slightly more than housing and food at 19 per cent and 17 per cent, respectively. Use synonyms
In contrast
, fuel-and-power and personal Linking Words
goods
constitute a mere %4. Interestingly, spending on clothing and footwear halved during the period, reaching %5, Use synonyms
whereas
the expenditure on household Linking Words
goods
remained the same at approximately %8.Use synonyms