
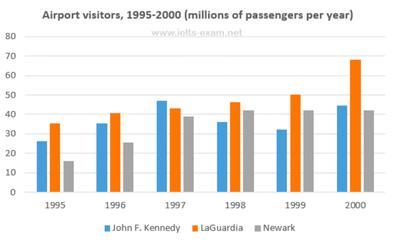
The line graph gives information about how many of the
travelers
use their major airports in New York City namely Change the spelling
travellers
John
. Use synonyms
LaGuardia
and Use synonyms
Newark
between 1995 and 200 years
Use synonyms
Overall
the Linking Words
number
of Use synonyms
LaGuardia
showed rising trends, Use synonyms
whereas
that of Linking Words
Newark
saw small with Use synonyms
LaGuardia
having the biggest and Use synonyms
Newark
very low .
Use synonyms
According to
the line graph that showed Linking Words
John
Use synonyms
F
. average 25 %percentage of the Use synonyms
number
of travellers in the 1995 Use synonyms
year
. Use synonyms
LaGuardia
gradual 35Use synonyms
%proportion
of the Use synonyms
number
of travellers in the 1995 Use synonyms
year
. Use synonyms
Newark
fell 15Use synonyms
%percentage
of Use synonyms
number
travels in the 1995 Use synonyms
year
.
Use synonyms
John
Use synonyms
F
. rose 33Use synonyms
%proportion
of the Use synonyms
number
of travels in the 1996 Use synonyms
year
. Use synonyms
LaGuardia
dramatic 40 %percentage of Use synonyms
number
travels in 1996 years. Use synonyms
Newark
a little rising 23Use synonyms
%proportion
of Use synonyms
number
travels Use synonyms
trawells
in the 1996 Correct your spelling
travels
year
.
Use synonyms
John
Use synonyms
F
. significant rising 45 % percentage of Use synonyms
number
travel in the 1997 Use synonyms
year
. Use synonyms
LaGuardia
presumablyUse synonyms
42
Correct your spelling
42 %proportion
%proportion
of the Use synonyms
number
travels in Use synonyms
the
1997 Correct article usage
apply
year
.Use synonyms
Newark
's steady 38Use synonyms
%percentage
of the Use synonyms
number
travels in the 1997 Use synonyms
year
. Use synonyms
John
Use synonyms
F
. decline 33 %proportion of Use synonyms
number
travels in Use synonyms
1998
Change the article
the 1998
year
. Use synonyms
LaGuardia
slight 43 %percentage of Use synonyms
number
travels in the 1998 Use synonyms
year
. Use synonyms
Newark
's steady 41 %percentage of the Use synonyms
number
travels in the 1998 Use synonyms
year
. Use synonyms
John
Use synonyms
F
. fall 32 % proportion of Use synonyms
Use synonyms
number
travels in the 1999 Correct article usage
the number
year
. Use synonyms
LaGuardia
sudden 50 %proportion of Use synonyms
number
travels in the 1999 Use synonyms
year
. Use synonyms
Newark
minimal rising 41Use synonyms
%percentage
of Use synonyms
number
Use synonyms
tralls
in the 1999 Correct your spelling
trails
trials
year
. Use synonyms
John
Use synonyms
F
. marked 43 %proportion of Use synonyms
Use synonyms
number
travels in the 2000 Correct article usage
the number
year
. Use synonyms
LaGuardia
sharp 69Use synonyms
%percentage
of Use synonyms
number
travels in the 2000 Use synonyms
year
.Use synonyms
Newark
a little rising 41 %proportion of Use synonyms
number
travels in the 2000 Use synonyms
year
.Use synonyms