
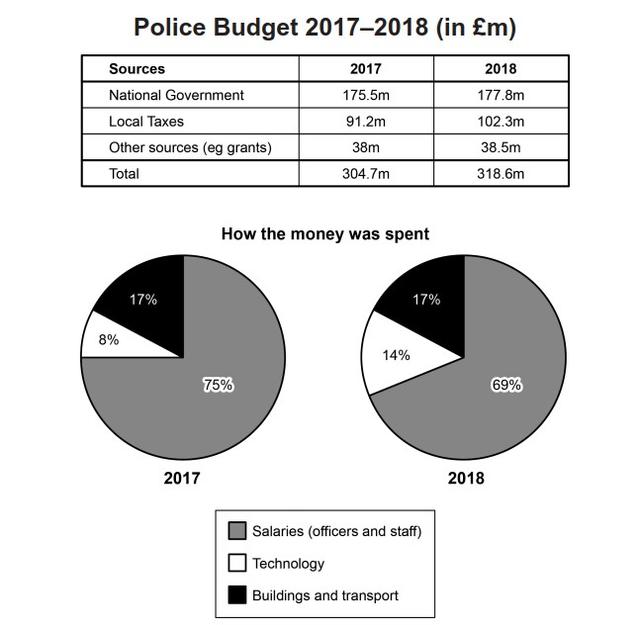
The presented table and pie charts describe the police forecasted financial
budget
for 2017 and 2018 Use synonyms
together with
sources of money and how it was spent.
The Linking Words
budget
was offered from three sources which consist of the National government, Local taxes and others (e.g. grants). Use synonyms
Also
, the police spent money on three main groups of expenses (salaries for officers and staff, technology and building and transport).
Linking Words
Overall
, the total Linking Words
budget
in 2018 slightly increased from 2017 to approximately 13.9 Use synonyms
million
. The biggest portion of both years came from the National government amounting to 175.5 Use synonyms
million
in 2017 and 177.8 Use synonyms
million
in 2018. Use synonyms
In addition
, Local taxes were the second biggest source which contributed around 91.2 Linking Words
million
in 2017 and 102.3 Use synonyms
million
in 2018. The Use synonyms
budget
from other sources remained stable.
Use synonyms
Furthermore
, the proportion of spending in 2017 and 2018 was similar. The top position was salaries expenses followed by building and transport and technology relatively. The salaries expenses insignificantly decreased from 75% in 2017 to 69% in 2018. Linking Words
On the other hand
, technology costs rose from 8% to 14%. Meanwhile, building and transport fees stayed constant at 17%.Linking Words