
The
given
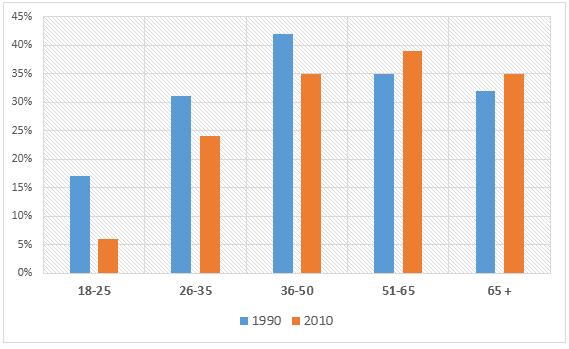
bar graph provides data about the percentage of people in the UK giving money to donations by different age Verb problem
apply
range
over a period of two decades starting from 1990.
Correct subject-verb agreement
ranges
Overall
,it is clear from the graph that every person from each generation donated a significant amount of money.Linking Words
Linking Words
However
the most Add a comma
However,
dramatical
rise Replace the word
dramatic
of
Change preposition
in
donation
was experienced by citizens of 36 to 50 Fix the agreement mistake
donations
years
.
In 1990,15% of people from 36 to 50 Use synonyms
years
helped financially,which is shown as the highest level of charity in the given chart,Use synonyms
Linking Words
additionally
more than 30% of adults from 26 to 35 donated a dramatic percentage of Add a comma
additionally,
fundings
Fix the agreement mistake
funding
whereas
there was a gradual decrease in 2010,that caused a fall of about 15 % and 7% respectively.
In 2010,Linking Words
percentage
of Correct article usage
the percentage
donation
by 51 to 65 Fix the agreement mistake
donations
years
old people rose gradually, Use synonyms
that
became the optimal level of charity of that year,Correct pronoun usage
which
while
citizens over 65 Linking Words
years
experienced the same.Use synonyms