
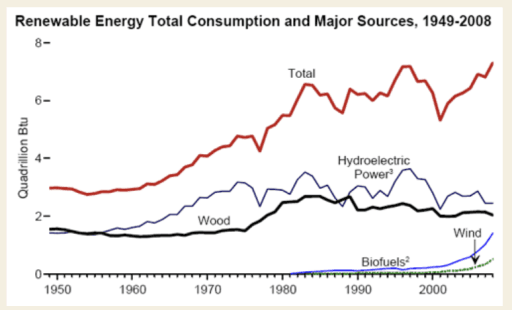
The line graph highlights data about how much renewable energy was consumed in the USA, over a 59-year period from 1949 to 2008.
Overall
, it is clearly seen that all kinds of renewable energy witnessed a significant increase.
Looking into detail, as regards Linking Words
overall
and hydroelectric power consumption, they went in a similar direction until 2000. The former started at 3.6 Linking Words
quadrillion
Use synonyms
Btu
which doubled the latter at the beginning of the period. Regarding the former and latter, they rose substantially from 2.4 to 7 and 1.8 to 2 Use synonyms
quadrillion
Use synonyms
Btu
respectively, despite some fluctuations over the period in question. As for wood, it remained relatively constant until 1975, accounting for 1.6 Use synonyms
quadrillion
Use synonyms
Btu
, after which it experienced negligible growth until 1989, reaching its peak (2.5 Use synonyms
quadrillion
Use synonyms
Btu
).
If we look at biofuels and wind, there was little difference between the number of biofuels and wind, as the former made up 1.4 Use synonyms
quadrillion
Use synonyms
Btu
, Use synonyms
while
the latter was lower by a margin of 0.3 Linking Words
quadrillion
Use synonyms
Btu
in 2009.Use synonyms