
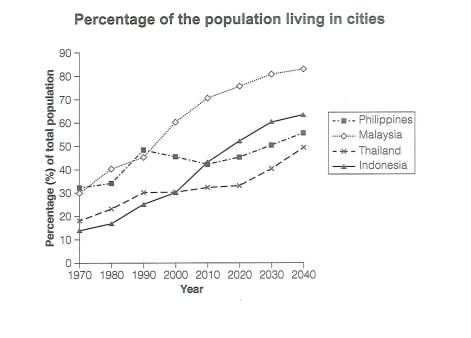
The line chart depicts the portion of residents in several Asian nations living in town from 1970 to 2020 with expectations for 2030 to 2040.
Overall
, it is clearly apparent, that Malaysia has the highest ratio in population Linking Words
besides
that Thailand has been categorized as the lowest place in four decades.
Linking Words
To begin
with, Malaysia was the top second in citizens from Linking Words
beginning
of 1970 till 1990 with Correct article usage
the beginning
the
increment in the population of around 11% (41%), afterwards, it illustrates sharply upwards and stood at roughly 86%.Correct article usage
an
On the other hand
, the Philippines was recognised first highest in population in 1970 with nearly 32% natives, Linking Words
then
in 1990 it reached somewhere 50% and faced a steep decline of approximately 8% from where it had a steady increase and is expected to reach back in 1990 percentage in 2040.fggddgvbtnbvbhnjbhgvfcdxacfvgbhnjhnbgvfcdcfvgbhnjmnhgbgfdcxswerftyuyjLinking Words