
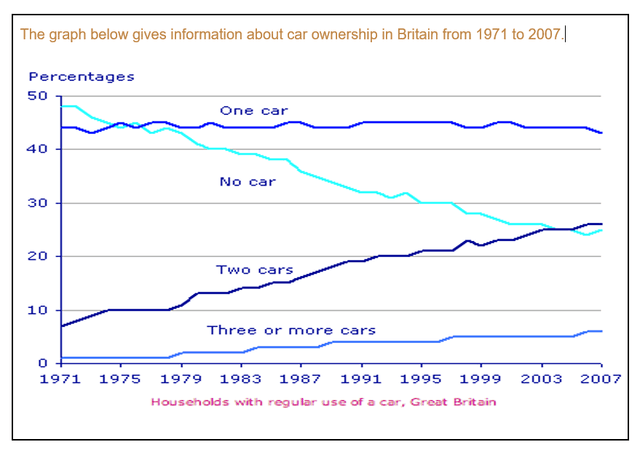
The line graph illustrates how many
cars
were owned by Use synonyms
people
in Britain between 1971 and 2007.
Use synonyms
Overall
, Linking Words
people
who owned no Use synonyms
car
in the beginning were the dominant type but in the end, most Use synonyms
people
had Use synonyms
one
Use synonyms
car
. Use synonyms
In contrast
, three or more Linking Words
Use synonyms
cars type
reported the least interest humans showed.
In 1971, Fix the agreement mistake
car types
people
Use synonyms
which
had no Correct pronoun usage
who
car
topped the year at almost 50% Use synonyms
while
Linking Words
people
Use synonyms
had
Correct pronoun usage
who had
one
Use synonyms
car
was the second highest in the same year. In the following year, there was a clash in the figure at 50% in 1975. The Use synonyms
people
who owned Use synonyms
one
Use synonyms
car
witnessed variations before hitting the top of the chart at 43 % by 2007. Use synonyms
However
, no Linking Words
car
started to decline and stopped in 2007 at 25%.
Use synonyms
Furthermore
, the proportion of two Linking Words
cars
started to rise until 1974, Use synonyms
then
remained stable for around two years and continued to grow in an upward direction and came to an end by reaching the point where no Linking Words
car
ended. And the Use synonyms
last
Linking Words
one
is the three or more Use synonyms
cars
Use synonyms
people
had, it started with a stable trend and ended at 6% in 2007.Use synonyms