
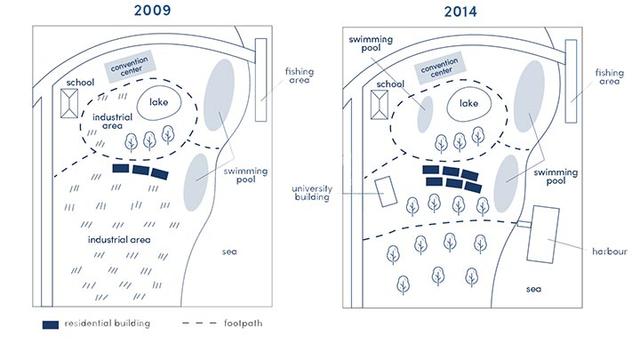
The diagram below illustrates how the waterfront area of a town called Darwin developed between 2009 and 2014.
Overall
, the realm did not change that much since some institutions were still in the same places Linking Words
such
as schools, fishing realms and convention centres. Linking Words
Nevertheless
, many developments occurred, Linking Words
besides
that, more trees were planted, in 2009, there were only trees but in 2014 many trees increased by over 10.
Linking Words
Firstly
, in 2009, the lake was surrounded by a footpath which was the only route to visit the sea. there were 2 industrial areas, Linking Words
however
, the places were replaced by a swimming pool and university building, Linking Words
furthermore
, the black buildings ascended from 3 to 6 five years later.
Linking Words
Secondly
, in 2014, apart from the increasing number of plants, a swimming pool was added near the lake Linking Words
hence
there were 3 pools during the period, Linking Words
in addition
, the harbour was built beside the sea and the crowds could follow the new footpath to go to the place.Linking Words