
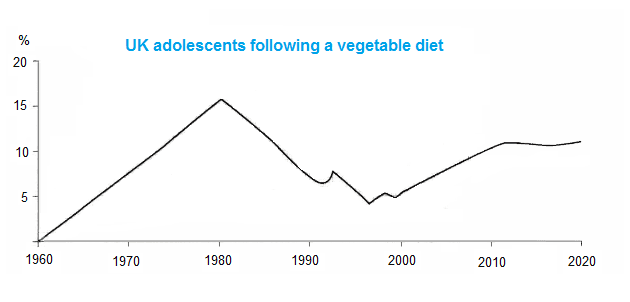
The line graph provides information about the proportion of UK teenagers following a vegetarian diet between 1960 - 2020 in the UK.
Overall
, what stands out from the line graph is that the percentage of young people who ate a vegetable diet in 1980 was the highest. Linking Words
While
around 1990 to 2000 were the lowest from Linking Words
this
period.
Linking Words
According to
the first data collected in 1960, the starting point increased dramatically to 15% in 1980 which was the peak of the graph. After that, the percentage fell significantly to just over 5% in 1990.
Linking Words
In addition
, the proportion of young citizens who liked eating plants to lose weight from 1990 to 2000 fluctuated between 5% - 10%. Linking Words
However
, in 2000 had a moderate increase from 5% to 10% in 2010. Linking Words
Moreover
, the percentage of adolescents who consumed a plant diet from 2010 to 2020 remained stable at 10% for 10 years.Linking Words