
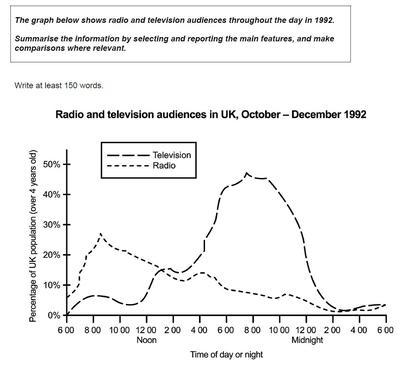
The provided line graph shows the
number
of people who spent the whole day watching Use synonyms
television
and listening to the Use synonyms
radio
in December 1992.
The statistic is presented in the percentage of the UK population which excludes children aged under or equal to four years old.
Use synonyms
Overall
, peak periods of Linking Words
television
watching and Use synonyms
radio
listening were completely different. The Use synonyms
number
of Use synonyms
radio
audiences was higher in the morning, meanwhile it was lower than the Use synonyms
number
of Use synonyms
television
viewers in the evening. Use synonyms
Radio
audiences significantly increased from 9% at 6 a.Use synonyms
m
. to almost 30% at 9 a.Use synonyms
m
., Use synonyms
then
it continuously decreased to 1% at 2 a.Linking Words
m
. Use synonyms
On the other hand
, the Linking Words
number
of Use synonyms
television
audiences was on an upward trend during the daytime. It sharply rose from 15% at 3 p.Use synonyms
m
. to 45% at 8 p.Use synonyms
m
. Use synonyms
However
, it dramatically went down to 1% at 2 a.Linking Words
m
. Use synonyms
Lastly
, the off-peak period for both Linking Words
television
and Use synonyms
radio
is 2 a.Use synonyms
m
.Use synonyms