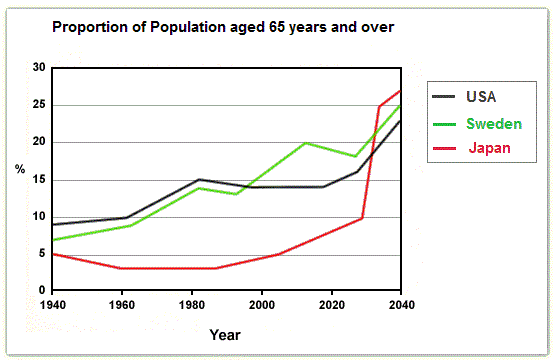
The graph below shows the proportion of the population aged 65 and over between 1940 and 2040 in three different countries. Summarise the information by selecting and reporting the main feature and make comparisons where relevant.

7.0 / 9
✍️ Want to check your own essay?Write on this topic →
The graph below shows the proportion of the population aged 65 and over between 1940 and 2040 in three different countries. Summarise the information by selecting and reporting the main feature and make comparisons where relevant.
IELTS Writing Task Chart for The graph below shows the proportion of the population aged 65 and over between 1940 and 2040 in three different countries. Summarise the information by selecting and reporting the main feature and make comparisons where relevant.
The line graph illustrates Japan’s population across three
age
Use synonyms
groups, namely 0-14, 25-64 and 65+, from 1960 to 2040, with figures measured in millions.
Overall
Linking Words
, the
proportion
Use synonyms
of
people
Use synonyms
aged 25-64 remained the largest over the period, despite a gradual decline after peaking in 1970.
By contrast
Linking Words
, the 0-14
age
Use synonyms
group experienced a downward trend,
while
Linking Words
the
proportion
Use synonyms
of elderly
people
Use synonyms
aged 65+ rose steadily. Looking first at two younger
age
Use synonyms
groups, the population aged 0-14 stood at 30 in 1960 and increased slowly to a peak of just 34 in 1970. It
then
Linking Words
declined consistently, reaching about 26 in 1980 and around 18 in 2000.
This
Linking Words
downward trend is expected to continue, with the figure
fall
Wrong verb form
falling
show examples
significantly to 12 in 2020 and approximately 7 in 2024. Meanwhile, the
proportion
Use synonyms
of
people
Use synonyms
aged 25-64 remained considerably the
lagest
Correct word choice
largest
show examples
throughout the period. Its population rose slightly from 64 in 1960 to a peak of 68 in 1970, after fluctuating slowly around 60 until 2000.
Thereafter
Linking Words
, it
Linking Words
then
Rephrase
apply
show examples
declined substantially between 62 in 2010 and 52 in 2030, before recovering slightly to approximately 54 in 2040. Regarding the oldest
age
Use synonyms
group, the
proportion
Use synonyms
aged 65+ followed the opposite pattern. Starting at only 4 in 1960,
after
Change preposition
apply
show examples
the figure climbed moderately from about 9 in 1990 to 18 in 2010.
This
Linking Words
growth is projected to continue throughout the period, with the number of elderly
people
Use synonyms
rose
Wrong verb form
rising
show examples
considerably to
nearby
Rephrase
nearly
show examples
23 in 2020, just 26 in 2030 and 30 in 2040.

Unauthorized use and/or duplication of this material without express and written permission from this site's author and/or owner is strictly prohibited. Excerpts and links may be used, provided that full and clear credit is given to Writing9 with appropriate and specific direction to the original content.

Vocabulary: Replace the words age, proportion, people with synonyms.
Vocabulary: The word "figures" was used 3 times.
Vocabulary: The word "proportion" was used 4 times.
Vocabulary: The word "trend" was used 2 times.
Vocabulary: The word "decline" was used 3 times.
Vocabulary: The word "downward" was used 2 times.
Vocabulary: The word "remained" was used 2 times.
Vocabulary: The word "approximately" was used 2 times.
Vocabulary: The word "about" was used 2 times.
Vocabulary: The word "around" was used 2 times.
Vocabulary: The word "slowly" was used 2 times.
Vocabulary: The word "considerably" was used 2 times.
Vocabulary: The word "slightly" was used 2 times.
What to do next:
Look at other essays: