
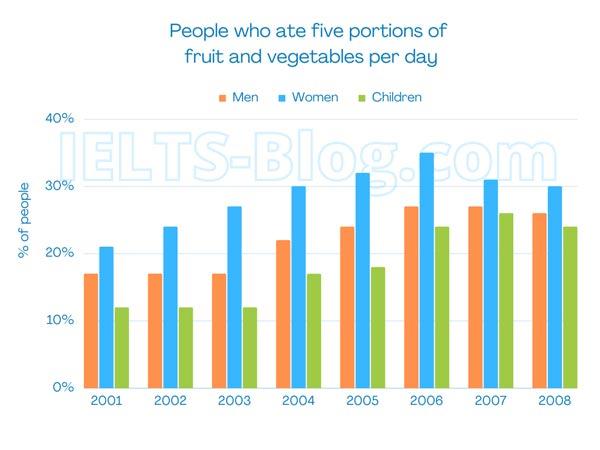
The bar charts
gives
information about the percentages of Correct subject-verb agreement
give
children
, Use synonyms
men
and women in the UK who consumed five portions of fruits and vegetables per day between 2001 and 2008.
Use synonyms
Overall
, women consistently recorded the highest proportions of people consuming five portions of fruits and vegetables per day, Linking Words
while
Linking Words
children
generally had the lowest figures. All three groups experienced an upward trend over the period, Use synonyms
although
the percentages fluctuated slightly towards the end.
Looking first at Linking Words
children
and Use synonyms
men
, both groups showed an upward trend. In 2001, the figures stood at around 13% for Use synonyms
children
and about 17% for Use synonyms
men
. The proportion of Use synonyms
children
remained unchanged until 2003, after Use synonyms
rose
steadily to 18% in 2004, 19% in 2005 and 22% in 2006. It Correct pronoun usage
which it rose
then
climbed Linking Words
sharly
to a peak of 27% in 2007, after Correct your spelling
sharply
fell
slightly to 24% in 2008. Meanwhile, the figure for Wrong verb form
falling
men
increased gradually 20% in 2004, 23% in 2005 and 28% in 2006. After that, it Use synonyms
then
declined slowly to 27% in 2007 and 26% in 2008.
Regarding women, they consistently had the highest figures throughout the period. Starting at 23% in 2001, the figure rose slightly to 24% in 2002 and Linking Words
then
increased gradually to 26% in 2003. It continued to grow, reaching 28% in 2004 and 30% in 2005, after peaking at 35% in 2006. Linking Words
However
, the figure fell significantly to 31% in 2007 and declined slowly to 30% in 2008.Linking Words