
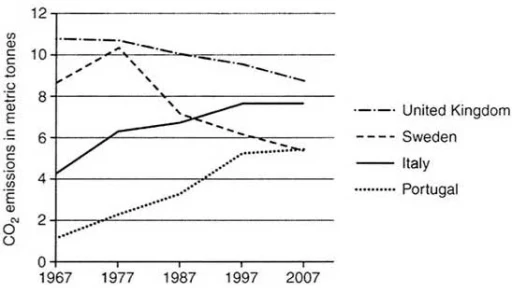
The graph below shows average carbon dioxide (CO2) emissions per person in the United Kingdom, Sweden, Italy and Portugal between 1967 and 2007.
The chart illustrates normal carbon dioxide emissions for one individual in the United Kingdom, Italy, Sweden and Portugal in 4 decades.
Overall
, Linking Words
amount
of CO2 emissions in Portugal and Italy experienced Add an article
the amount
increase
over the entire period, Add an article
an increase
while
Sweden and Linking Words
United
Kingdom experienced Add an article
the United
decrease
. England maintained its leading position throughout the entire period.
2nd
Add an article
a decrease
This
graph shows the proportion of four different materials that were recycled from 1982 to 2010 in a particular country.
The chart demonstrates the figures Linking Words
of
four various materials which were recycled between 1982 and 2010 in a specific country.
Change preposition
for
Overall
, paperLinking Words
and
cardboard and glass containers experienced Fix punctuation
,
high
recycling rate throughout the entire period. Aluminium cans showed the most significant increase, Add an article
a high
while
plastics remained the least recycled material.Linking Words