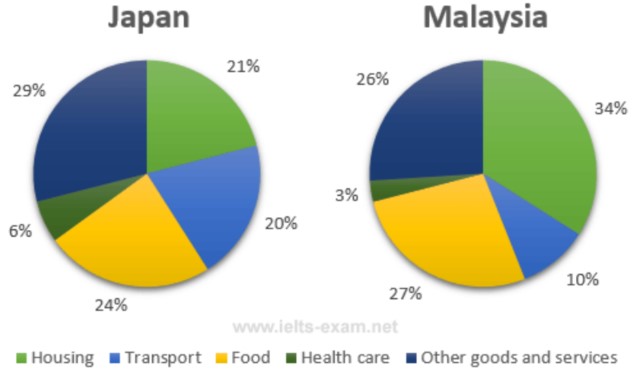
The pie chart below show the average house hold expenditures im Japan and Malaysia

4.0 / 9
✍️ Want to check your own essay?Write on this topic →
The pie chart below show the average house hold expenditures im Japan and Malaysia
IELTS Writing Task Chart for The pie chart below show the average house hold expenditures im Japan and Malaysia
The two charts illustrate the proportion of average household costs in various countries,
such
Linking Words
as Japan and Malaysia
in
Fix punctuation
, in
show examples
2010.
Overall
Linking Words
, it is obvious that the most money
allocated
Verb problem
was allocated
show examples
to other goods and services in
Japan
Fix punctuation
Japan,
show examples
while
Linking Words
housing was the most
preffered
Fix spelling
preferred
in Malaysia.
However
Linking Words
, both of them spent the least
expense to
Change preposition
on
show examples
health care.

Unauthorized use and/or duplication of this material without express and written permission from this site's author and/or owner is strictly prohibited. Excerpts and links may be used, provided that full and clear credit is given to Writing9 with appropriate and specific direction to the original content.

Sentences: Add more complex sentences.
▼
Basic structure: Write more paragraphs.
▼
Basic structure: Add more body paragraphs.
▼
Common mistake: Your writing should be 150-250 words.
Basic structure: Write more paragraphs.
▼
Vocabulary: Only 3 basic words for charts were used.
▼
Vocabulary: Use several vocabularies to present the data in the second paragraph.
▼
What to do next:
Look at other essays: