
Before
us
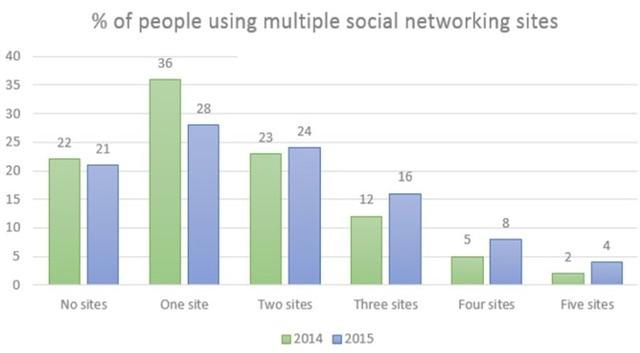
we have a bar graph that quantifies the citizens of Canada who utilized social media Add a comma
,us
sites
in two consecutive years 2014 and 2015.
In general, maximum Use synonyms
Canadians
were interested in using a single social networking site in both time periods. Change preposition
of Canadians
However
, Linking Words
people
who loved using five Use synonyms
sites
for social media communication occupied the least possible place in the same years.
As a starting point, 36% of Canadians utilized one social site in 2014 which is followed by a slight decrease of 8% of Use synonyms
people
in the following year. Followed by that, there is a minor decrease in Use synonyms
percentage
of Add an article
the percentage
people
from 22% to 21% who rarely used social Use synonyms
sites
, and only one more percentage of Canadians were using two Use synonyms
sites
for communicating in 2015 than that in 2014.
Use synonyms
In contrast
, the Linking Words
numbers
who liked using five Fix the agreement mistake
number
sites
doubled from 2% to 4% between the years 2014 and 2015. As a final point, we can observe a slight upgrade in Use synonyms
percentage
of Add an article
the percentage
people
who used three Use synonyms
sites
and four Use synonyms
sites
with an increment of 4% and 3% respectively.Use synonyms