The graph below shows the number of university graduates in Canada from 1992 to 2007. Summarise the information by selecting and reporting the main features and make comparisons where relevant.

The graph below shows the number of university graduates in Canada from 1992 to 2007. Summarise the information by selecting and reporting the main features and make comparisons where relevant.
IELTS Writing Task Chart for The graph below shows the number of university graduates in Canada from 1992 to 2007. Summarise the information by selecting and reporting the main features and make comparisons where relevant.
✨ Do you want to improve your IELTS writing?
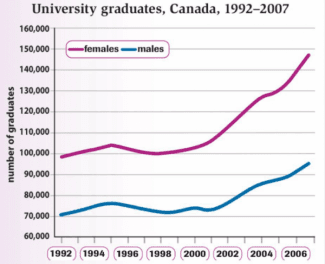
The supplied line graph describes the
amount
Change the quantifier
number
show examples
of
students
Use synonyms
graduated
Correct pronoun usage
who graduated
show examples
from Canadian universities commencing from 1992 to 2007.
Overall
Linking Words
, the female
gradutes
Correct your spelling
graduates
supersede the number of male graduates.
Furthermore
Linking Words
, female and male
students
Use synonyms
have an upward trend in the given time frame. As provided in the graph, over the period of 1992 to 2000, the number of male and female
students
Use synonyms
experienced a minor fluctuation.
In
Change preposition
From
show examples
Change the article
the year
show examples
year
Fix the agreement mistake
years
show examples
1992 to 1995, a slight increase in
number
Correct article usage
the number
show examples
occured
Correct your spelling
occurred
of approximately over 10000 for
female
Fix the agreement mistake
females
show examples
and over 5000
for
Change preposition
apply
show examples
male
students
Use synonyms
. In figures, females originally almost 100000 became 110000 and male graduates roses from 70000 to 75000. Before the year 1996, the digits declined on a small scale and had some fluctuations
on
Change preposition
in
show examples
the
next
Linking Words
four years. In 2001, the statistics started to rose again by 50000 for females and 25000 for males in reference to the figure in the year 1992.

Unauthorized use and/or duplication of this material without express and written permission from this site's author and/or owner is strictly prohibited. Excerpts and links may be used, provided that full and clear credit is given to Writing9 with appropriate and specific direction to the original content.

Sentences: Add more complex sentences.
Basic structure: Write more paragraphs.
Basic structure: Add more body paragraphs.
Common mistake: Your writing should be 150-250 words.
Basic structure: Write more paragraphs.
Vocabulary: Replace the words students with synonyms.
Vocabulary: The word "graph" was used 2 times.
Vocabulary: The word "figures" was used 2 times.
Vocabulary: The word "number of" was used 2 times.
Topic Vocabulary:
  • general trend
  • fluctuations
  • peaks
  • dips
  • significant differences
  • increase/decrease
  • comparison
  • data
  • period
  • economic conditions
  • policy changes
  • cultural shifts
  • implications
  • workforce
  • economy
What to do next:
Look at other essays: