The chart below shows information about changes in average house prices in five different cities between 1990 and 2002 compared with the average house price in 1989. Summarise the information by selecting and reporting the main features, and make comparisons where relevant.

The chart below shows information about changes in average house prices in five different cities between 1990 and 2002 compared with the average house price in 1989. 

Summarise the information by selecting and reporting the main features, and make comparisons where relevant.
There are 5 different cities between 1990-2002. 
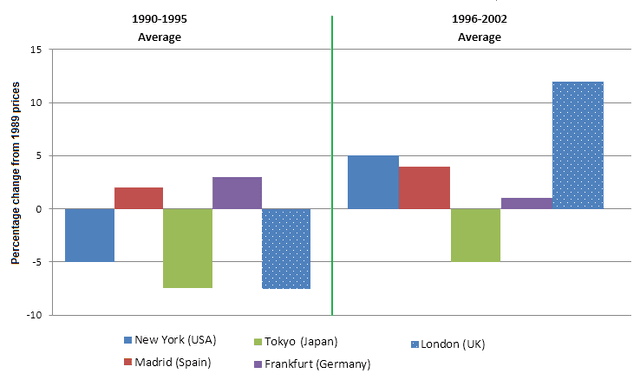
During 1990-1995 in New York, USA,
-5
Correct article usage
the -5
show examples
average percentage change from 1989
prices
, which is a 5 average
percent
Change the spelling
per cent
show examples
adjustment in 1996-2002. During 1990-1995 in Madrid, Spain, it is
2
Correct article usage
a 2
show examples
average percentage change from 1989
prices
while
during 1996-2002, it is a 4 average
percent
Change the spelling
per cent
show examples
adjustment. During 1990-1995 in Tokyo, Japan, it is
-8
Correct article usage
a -8
show examples
average percentage change from 1989
prices
while
during 1996-2002 is
-5
Correct article usage
a -5
show examples
average
percent
Change the spelling
per cent
show examples
adjustment. During 1990-1995 in Frankfurt, Germany, it is 3 average rate development from 1989
prices
while
1 average proportion difference during 1996-2002.
Lastly
, during 1990-1995 in London, UK, it is
-8
Correct article usage
an -8
show examples
average proportion difference from 1989
prices
while
during 1996-2002 it increases to 12 average proportion difference.
Therefore
, I conclude that London has
the
Add a missing verb
had the
show examples
biggest development in average house
prices
since 1989 between 1990-1995 and 1996-2002.
Submitted by elahuang1 on

Unauthorized use and/or duplication of this material without express and written permission from this site’s author and/or owner is strictly prohibited. Excerpts and links may be used, provided that full and clear credit is given to Writing9 with appropriate and specific direction to the original content.

Sentences: Add more complex sentences.
Linking words: Don't use the same linking words: "while".
Introduction: The introduction is missing.
Introduction: Change the first sentence in the introduction.
Introduction: The chart intro is missing.
Common mistake: Your writing should be 150-250 words.
Basic structure: Change the first paragraph.
Basic structure: Change the fourth paragraph.
Introduction: The chart intro is missing.
Vocabulary: Replace the words prices with synonyms.
Vocabulary: Only 5 basic words for charts were used.
Vocabulary: The word "change" was used 3 times.
Vocabulary: The word "difference" was used 3 times.
Vocabulary: The word "percentage" was used 3 times.
Vocabulary: The word "proportion" was used 3 times.
Vocabulary: Use several vocabularies to present the data in the first paragraph.
Vocabulary: Use several vocabularies to present the data in the fourth paragraph.
What to do next:
Look at other essays: