
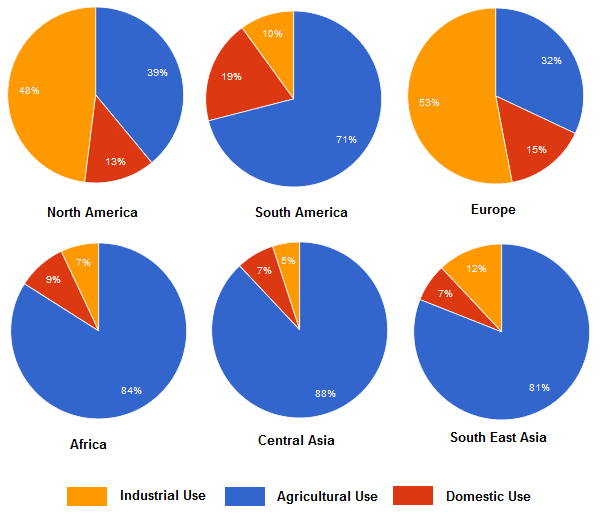
The table provides data on how much
water
is used for agriculture, industry and domestic purposes in six states.
Use synonyms
Overall
, Linking Words
it is clear that
developing countries tend to Linking Words
use
more Use synonyms
water
for agriculture, Use synonyms
whereas
developed countries Linking Words
use
more Use synonyms
water
for industry. Use synonyms
Further
, domestic Linking Words
water
Use synonyms
use
is the lowest of the three categories in all countries except Use synonyms
Brazil
and Nigeria.
Looking at the agriculture data sets in more detail, it can be seen that the percentage of Use synonyms
water
which was used is the highest in Nigeria at 86%, followed closely by Use synonyms
Brazil
at 84%. Australia, Germany and the UK all show similar levels of Use synonyms
water
Use synonyms
use
, at 38%, 32% and 28%, respectively.
Turning to data sets for industry, it is evident that Use synonyms
Use synonyms
use
of Correct article usage
the use
water
for Use synonyms
this
purpose is the highest in the UK, at 67%. The percentage of Linking Words
water
which was used is the lowest in Nigeria, at 3%, which is the lowest value on the table. Industrial Use synonyms
water
Use synonyms
use
is the same in India and Use synonyms
Brazil
, both at 9%.
Use synonyms
Finally
, Linking Words
water
Use synonyms
use
for domestic purposes is the highest in Use synonyms
Brazil
, at 17%, followed by Australia at 14%, Use synonyms
while
the lowest usage of Linking Words
water
for Use synonyms
this
purpose is in the UK, at 5%.Linking Words