
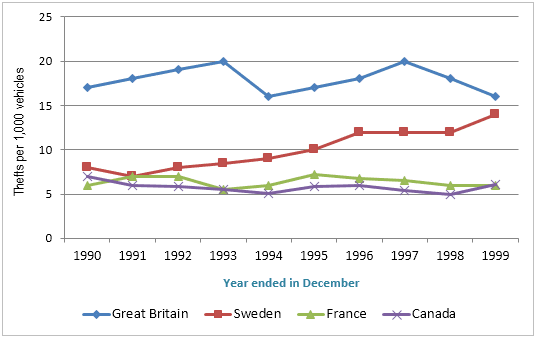
The line graph illustrates the amounts of other
vehicles
Use synonyms
are
stolen in four different countries, namely: Great Unnecessary verb
apply
Britain
, Sweden, Use synonyms
France
and Canada between 1990 to 1999.
Use synonyms
Overall
, Linking Words
it is clear that
during the given period diagram, the Linking Words
amount
of Use synonyms
car
Use synonyms
theft
in Great Use synonyms
Britain
and Use synonyms
France
experienced Use synonyms
fluctuation
trend, with the Correct article usage
a fluctuation
amount
of stealing Use synonyms
Use synonyms
car
in Great Fix the agreement mistake
cars
Britain
Use synonyms
was
the highest and Wrong verb form
being
France
Use synonyms
was
the lowest. Sweden was the Unnecessary verb
apply
second
nation with the Linking Words
amount
of Use synonyms
car
Use synonyms
theft
, and the following country was Use synonyms
France
.
Use synonyms
At
the beginning, the Change the preposition
In
amount
of Use synonyms
car
Use synonyms
theft
in Sweden was 8 per 1000 Use synonyms
vehicles
, after Use synonyms
that
it rose gradually to 12 Add a comma
,that
theft
per 1000 Use synonyms
vehicles
in 1996; Use synonyms
subsequently
, it continued to grow slightly to 14 Linking Words
theft
per 1000 Use synonyms
vehicles
in 1999.
The Use synonyms
amount
of Use synonyms
stealing
Wrong verb form
stolen
Use synonyms
car
in Canada went down steadily from 7 Fix the agreement mistake
cars
theft
per 1000 Use synonyms
vehicles
to 5 Use synonyms
theft
per 1000 Use synonyms
vehicles
from 1990 to 1993; Use synonyms
however
, between 1993 to 1999, it climbed slowly from 5 Linking Words
theft
per 1000 Use synonyms
vehicles
to 6 Use synonyms
theft
per 1000 Use synonyms
vehicles
.
Over a nine Use synonyms
year
between 1990 to 1999, there was a considerable fluctuation in the quantity of Fix the agreement mistake
years
stealing
Wrong verb form
stolen
Use synonyms
car
in Great Fix the agreement mistake
cars
Britain
, with the highest Use synonyms
amount
of Use synonyms
car
Use synonyms
theft
Use synonyms
was
about 20 Replace the word
being
theft
per 1000 Use synonyms
vehicles
in 1996 and the lowest was 17 Use synonyms
theft
per 1000 Use synonyms
vehicles
in 1999. At the same time, the Use synonyms
amount
of Use synonyms
stealing
Wrong verb form
stolen
Use synonyms
car
in Fix the agreement mistake
cars
France
Use synonyms
also
fluctuated moderately, and it remained Linking Words
at
Change preposition
in
the
Correct article usage
apply
last
place with the figure did not change at 6 Linking Words
theft
per 1000 Use synonyms
vehicles
.Use synonyms