The graph below shows the number of university graduates in Canada from 1992 to 2007. Summarise the information by selecting and reporting the main features and make comparisons where relevant. You should write at least 150 words.

The graph below shows the number of university graduates in Canada from 1992 to 2007. 

Summarise the information by selecting and reporting the main features and make comparisons where relevant.

You should write at least 150 words.
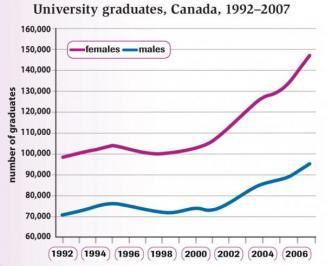
These data sources clearly communicate the graduation of Canada’s students in the 1992-2007
period
. Looking first as a whole, there are two distinct trends.
Firstly
, the number of females and males share similar rising trends, finishing with their highest level.
In addition
, the figure
of
Change preposition
for
show examples
females is always far higher than males. With respect to the number of graduates in females,
initially
, 100000 students graduated, before following a volatile pattern
around
Change preposition
of around
show examples
105000 people in the 1995 - 1998
period
. After that, the figure
rocket
Wrong verb form
rocketed
show examples
throughout the
next
9 years, reaching its peak, at 148000 which was the highest
overall
. As for the data
of
Change preposition
for
show examples
males, it was identical to
female’s
Change noun form
females
show examples
one
Correct pronoun usage
apply
show examples
in the first 2 years
period
, from 70000 to 78000 students
in
Change preposition
from
show examples
1992 to 1994, respectively. After that, it oscillated around 72000 people between 1995 and 2001, followed by experiencing burgeoning growth, ending the
period
by hitting a high of 95000.

Unauthorized use and/or duplication of this material without express and written permission from this site’s author and/or owner is strictly prohibited. Excerpts and links may be used, provided that full and clear credit is given to Writing9 with appropriate and specific direction to the original content.

Sentences: Add more complex sentences.
Introduction: The introduction is missing.
Introduction: Change the first sentence in the introduction.
Introduction: The chart intro is missing.
Vocabulary: Replace the words period with synonyms.
Vocabulary: The word "figure" was used 2 times.
Vocabulary: The word "data" was used 2 times.
Vocabulary: The word "number of" was used 2 times.
Vocabulary: The word "trends" was used 2 times.
Vocabulary: The word "around" was used 2 times.
What to do next:
Look at other essays: