
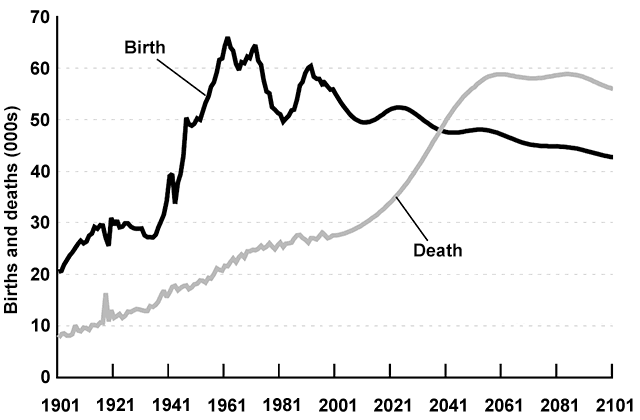
The line graph illustrates the
birth
and death rates' changes in New Zealand after 1901 and predicts these patterns up to 2101.
Use synonyms
Overall
, these conflicting patterns indicate that the death Linking Words
rate
will exceed the Use synonyms
birth
Use synonyms
rate
by 2035 and establish a wide gap between the two levels by the end of the century.
Since 1901, the Use synonyms
birth
Use synonyms
rate
has been steadily higher than the death Use synonyms
rate
. It started at around 20,000 and exploded Use synonyms
as
the record in 1961 at 65,000. The Change preposition
to
rate
has since oscillated between 50 thousand and 60 thousand, with the lowest at approximately 49,500 in 1982 and the highest Use synonyms
rate
at 61,000 in 1991. It is estimated to fall off gradually to about 44,000 births by the beginning of the 22nd century.
Use synonyms
Although
Linking Words
Use synonyms
birth
Correct article usage
the birth
rate
started at Use synonyms
such
a high number in 1901, the mortality Linking Words
rate
began below 10,000 and has risen steadily to the present day. Use synonyms
This
rise is expected to be more precipitous from 2020 to 2051 when the Linking Words
rate
will perhaps settle at roughly 60,000 before dropping marginally in 2101Use synonyms