
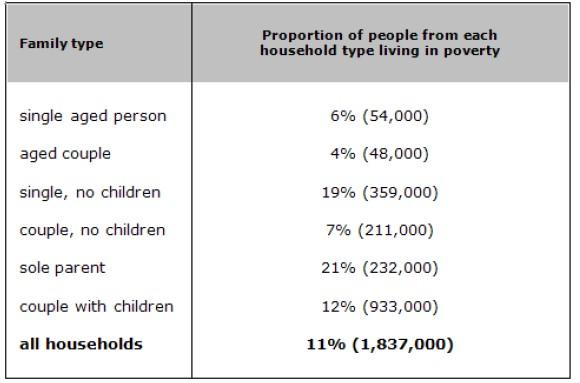
These data sources clearly
communicates
the Change the verb form
communicate
poverty
rates of six household types in Australia in 1999.
Use synonyms
Overall
, levels of Linking Words
poverty
were higher for single Use synonyms
people
than for couples, and Use synonyms
people
with Use synonyms
children
were more likely to be poor than those without. The lowest Use synonyms
poverty
rate was Use synonyms
elderly
Change preposition
among elderly
people
.
There was around 11% Use synonyms
Change preposition
of Australia
Australia
citizens, or 1,837,000 Correct your spelling
Australian
people
, were living in Use synonyms
poverty
in 1999. Aged Use synonyms
people
were the least likely to be poor, with Use synonyms
poverty
levels of 6% and 4% for Use synonyms
single
aged Add an article
the single
a single
person
and aged Fix the agreement mistake
persons
couple
, individually.
Single Fix the agreement mistake
couples
people
without Use synonyms
children
and sole Use synonyms
parent
and Fix the agreement mistake
parents
couple
Fix the agreement mistake
couples
had
Correct pronoun usage
who had
children
made up the majority of households Use synonyms
were
living in Unnecessary verb
apply
poverty
, with the figure being around 19%, 21% and approximately 12%, respectively. The percentage Use synonyms
for
Change preposition
of
couple
who have no Add an article
a couple
the couple
children
were much lower, its figures accounted for only 7% Use synonyms
in
all households' Change preposition
of
poverty
rates.Use synonyms