
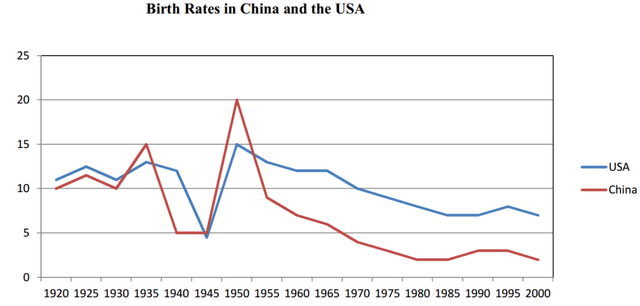
A glance at the graph provided reveals some striking similarities between the Chinese and US
birth
rates during the period from 1920 to 2000. It is evident that both nations saw considerable fluctuations in fertility, with lows during the 1940s and highs during the 1950s.
Increasing from approximately 10 Use synonyms
Use synonyms
percent
in 1920 to 15 Change the spelling
per cent
Use synonyms
percent
in 1935, China`s Change the spelling
per cent
birth
rate Use synonyms
then
plunged to a low of just 5 Linking Words
Use synonyms
percent
Change the spelling
per cent
inn
Correct your spelling
in
1940s
. Correct article usage
the 1940s
This
was followed by a period of exponential growth, with fertility in the country reaching a peak of 20 Linking Words
Use synonyms
percent
in Change the spelling
per cent
1950s
. The latter half of the century Change the article
the 1950s
Linking Words
however
, brought a sustained decline in Add the comma(s)
,however
this
figure.
The US Linking Words
birth
rate, meanwhile, fluctuated at somewhere between 11 and 13 Use synonyms
Use synonyms
percent
prior to 1940, before dropping sharply to less than 5 Change the spelling
per cent
Use synonyms
percent
in 1945. The following 5 years saw a rapid climb in Change the spelling
per cent
this
rate, to somewhere in the vicinity of 15 Linking Words
Use synonyms
percent
in 1950, followed by a steady fall.
It is interesting to note that Change the spelling
per cent
while
the Linking Words
birth
rates of both countries were comparable until 1950, the gap between the two widened Use synonyms
after
Linking Words
this
time as fertility in China slid away.Linking Words