The charts below show local government expenditure in 2010 and 2015. Summarise the information by selecting and reporting the main features, and make comparisons where relevant.

The charts below show local government expenditure in 2010 and 2015.

Summarise the information by selecting and reporting the main features, and make comparisons where relevant.
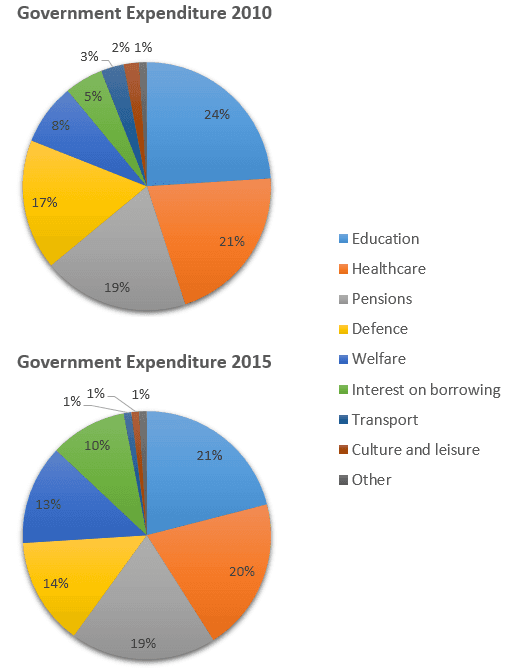
When we compare government expenditure spending between 2010 and 2015, we find that spending on Education has decreased,
as well as
spending on Culture and leisure, Defence, and Health.
On the other hand
,
the
Correct article usage
apply
show examples
investments in Welfare, Interest in borrowing, and Transport increased.
This
chart let us think about what is really important to the government, because what could be the reason for
this
change? Is transport more important than health? I do not think so. Ruling politicians must carefully analyse what is really important and essential for life before deciding where public money will be invested. Most of the time, they are more concerned with unnecessary things than with what is really needed. We conclude that it is necessary to study and understand what are the real needs of the population, and what will really make their lives better before investing public money, in what the government considers vital.
Submitted by cris_mg1994 on

Unauthorized use and/or duplication of this material without express and written permission from this site’s author and/or owner is strictly prohibited. Excerpts and links may be used, provided that full and clear credit is given to Writing9 with appropriate and specific direction to the original content.

Introduction: The introduction is missing.
Introduction: The chart intro is missing.
Basic structure: Change the second paragraph.
Introduction: The chart intro is missing.
Vocabulary: The word "go" was used 3 times.
Vocabulary: Use several vocabularies to present the data in the second paragraph.
What to do next:
Look at other essays: