
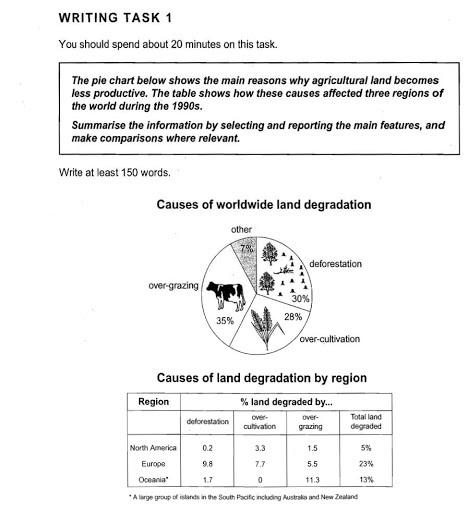
The pie chart illustrates the main reasons why
agricultural
continent becomes less productive. The Correct article usage
the agricultural
causes
are over-grazing, deforestation, over-cultivation, and other Use synonyms
causes
of worldwide land degradation. Use synonyms
In addition
, the table illustrates how these Linking Words
causes
, affected three Use synonyms
regions
of the world during the 1990s. The Use synonyms
regions
are North Use synonyms
America
, Use synonyms
Europe
, and Use synonyms
Oceania
.
Use synonyms
Firstly
, the pie chart shows that 35% of over-grazing is one of the main reasons for ground degradation. In Linking Words
Oceania
, a large group of islands in the South Pacific including Australia and New Zealand, used 11.3% of over-grazing, 5.5% in Use synonyms
Europe
, and 1.5% in North Use synonyms
America
. Use synonyms
Hence
, Linking Words
this
has the highest percentage among Linking Words
of
the other main reasons Change preposition
apply
of
land deterioration.
Change preposition
for
Secondly
, 30% of deforestation, which makes it the Linking Words
second
highest percentage Linking Words
next
to over-grazing. In Linking Words
Oceania
, Use synonyms
agricultural
continent becomes less productive by 1.7% of deforestation, 9.8% in Correct article usage
the agricultural
Europe
, and 0.2% in North Use synonyms
America
. Use synonyms
Thus
, these Linking Words
regions
are easily affected by natural disasters Use synonyms
such
as Linking Words
flood
, etc.
Fix the agreement mistake
floods
Thirdly
, 28% of over-cultivation worldwide is the cause of land degradation. In Linking Words
Oceania
, they don't support Use synonyms
this
procedure, meanwhile, 7.7% in Linking Words
Europe
, and 3.3% in North Use synonyms
America
.
In conclusion, 7% of other Use synonyms
causes
are affected worldwide. Use synonyms
On the other hand
, the most affected Linking Words
Use synonyms
regions
is Fix the agreement mistake
region
Europe
with 23% of the total field degraded, Use synonyms
second
is Linking Words
Oceania
with 13%, and Use synonyms
lastly
is North Linking Words
America
with 5%.Use synonyms