
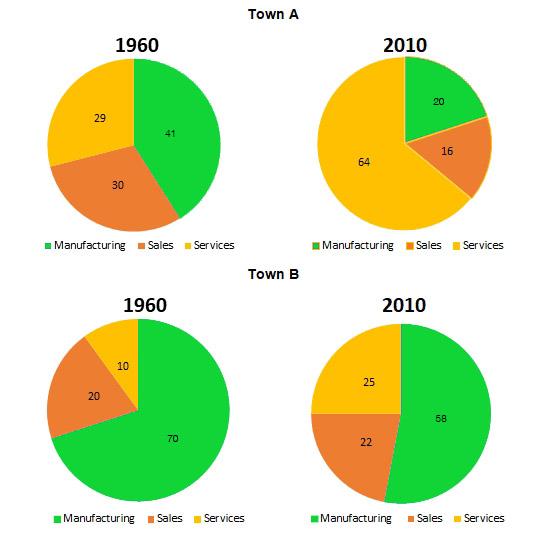
The pie charts give information about the proportion of
staffs
working in three various departments in Fix the agreement mistake
staff
town
A and Use synonyms
town
B between 1969 and 2010.
Looking at the graph, it is immediately obvious that employees who worked in manufacturing increased in both towns during the period shown. Use synonyms
However
, sales-related jobs were the greatest increase in Linking Words
town
A and Use synonyms
town
B.
Use synonyms
According to
the chart of Linking Words
town
A, it can be seen that workers in Use synonyms
manufacturing
department made up 41 Add an article
the manufacturing
Use synonyms
percent
which was the largest group. Change the spelling
per cent
This
was followed by a drop of 21 Linking Words
Use synonyms
percent
over the Change the spelling
per cent
next
40 years. Linking Words
Similarly
, sales-related Linking Words
occupation
declined slightly from 30 to 16 Fix the agreement mistake
occupations
Use synonyms
percent
. Change the spelling
per cent
Such
a trend was not seen in the figure for the proportion of staff working in services, which increased significantly by 36 Linking Words
Use synonyms
percent
.
Turing to Change the spelling
per cent
town
B, it is broadly similar to Use synonyms
town
A, the most staff were employed in manufacturing. Use synonyms
After
40 years later, Change preposition
apply
this
figure decreased to 53 Linking Words
Use synonyms
percent
. In 1960, 20 and 10 Change the spelling
per cent
Use synonyms
percent
of people worked in sales and services respectively. Change the spelling
per cent
On the other hand
, there was a gradual rise in the percentage of both those Linking Words
group
over a period of forty years.Fix the agreement mistake
groups