
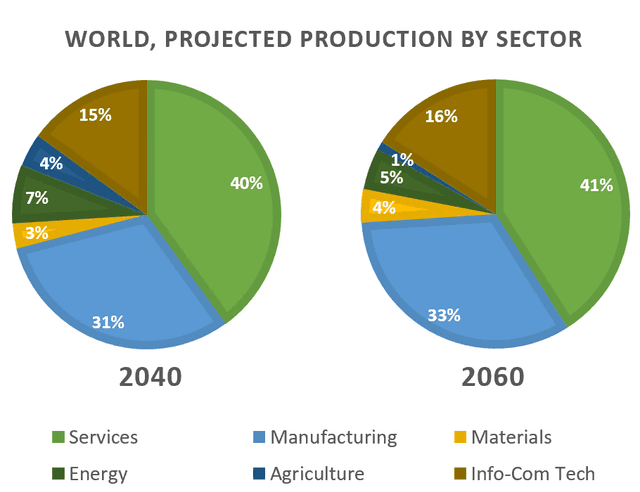
The two pie charts illustrate the world production forecasts displayed
on
five main fields in 2040 and after 20 years in 2060.
Change preposition
in
Overall
, there is no large difference between the 20 years given. Linking Words
While
materials and agriculture comprise the smaller amount in both years, manufacturing and services correspond to the biggest proportion. Linking Words
Furthermore
, the Linking Words
last
two sectors are responsible for more than half of the global economy.
With regards to the two most important sectors , the percentage of services will slightly increaseLinking Words
1
% from 40% Change preposition
by 1
whereas
the manufacturing industry will rise from 31% to 33% in the period which is given. Linking Words
In addition
, info-com tech and materials will grow 1% from 15% to 16% and from 3% to 4%, respectively.
Linking Words
By contrast
, crops will shrink 75% almost disappearing between 2040 to 2060 from only 4 % to 1%, and electricity will decrease steadily from 7% to 5 % during the 20 years-period.Linking Words