
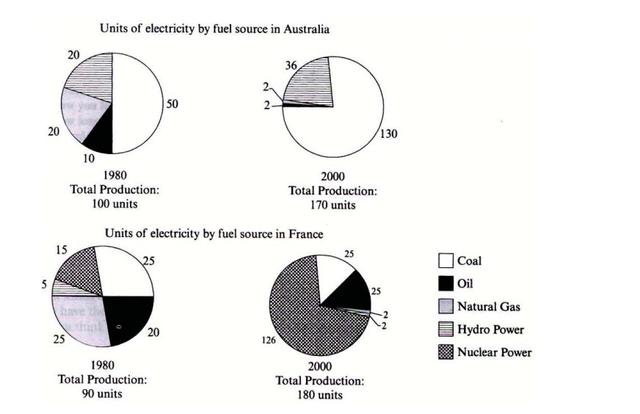
The pie charts illustrate how many
units
of Use synonyms
electricity
were produced/generated/manufactured from different kinds of fuel sources in two different countries in 1980 and 2000. Use synonyms
Although
the total energy manufacturing has increased over the two decades in terms of Linking Words
two
countries, the main reservoir in order to generate Correct article usage
the two
electricity
was coal for Australia in both years Use synonyms
while
France utilized more nuclear power in Linking Words
electricity
Use synonyms
production
in 2000.
Looking at the first graph in more detail, there were considerably more Use synonyms
units
of Use synonyms
electricity
generated in Australia in 2000 than in 1980, which amounted to 170 Use synonyms
units
. The majority of Use synonyms
electricity
Use synonyms
production
was derived from coal in both years. Meanwhile, oil was the least preferred power source Use synonyms
totalled
10 out of 100 Wrong verb form
totalling
units
and there was an equivalent unit of Use synonyms
electricity
supplied from hydropower and natural gas. After 20 years, coal, the largest source, dramatically increased to 130 Use synonyms
units
in 2000. Use synonyms
Moreover
, the Linking Words
electricity
city generated by hydropower increased almost twofold Use synonyms
stood
at 36. Wrong verb form
standing
On the other hand
, dependency on natural gas and oil in the Linking Words
production
of Use synonyms
electricity
was fallen to 2%.
Turning now to France, In 1980, fifty per cent of Use synonyms
electricity
Use synonyms
production
was met from coal and natural gas, and measured as 25 Use synonyms
units
for each out of 90 Use synonyms
units
. Use synonyms
While
the Linking Words
second
-highest Linking Words
electricity
generation was provided Use synonyms
from
oil, the least Change preposition
by
electricity
generation was from hydropower. It should be emphasized that ,unlike Australia, nuclear energy was used in Use synonyms
electricity
generation and 15 Use synonyms
units
of Use synonyms
electricity
were provided from Use synonyms
this
source in 1980. In 2000, the Linking Words
units
of Use synonyms
electricity
Use synonyms
production
increased by 80 Use synonyms
units
.
Use synonyms
Electricity
Use synonyms
production
from nuclear energy has overwhelmingly increased more than eight times and reached 126 out of 170 Use synonyms
units
, Use synonyms
whereas
Linking Words
electricity
Use synonyms
production
which met from coal remained stable. A slight increase was observed in oil-based Use synonyms
electricity
Use synonyms
production
and a tremendous decrease can be seen Use synonyms
from
natural gas-based Change preposition
in
electricity
Use synonyms
production
in 2020 in France.Use synonyms