
This
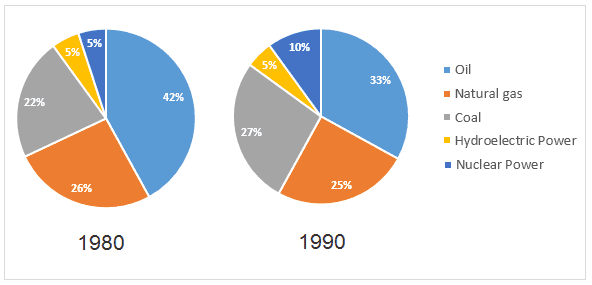
pie chart depicts the ratios of the sources of energy in two period: 1980 and 1990 in the United state. It is clear from the graph that oil and natural gas are the main sources with more that 50%.
Linking Words
According to
what is shown, the coal and the natural gas illustrated slightly difference by 22 and 26 per cent in the 80s Linking Words
then
to 27 and 25 per cent respectively which was over the half in the 90s.
meanwhile, the oil decreased gradually to 33% beforehand it was the substantial source of energy by nearly close to the half by 42% in the first period.
In both years hydroelectric power had the same percentage of 5 percent. Linking Words
while
the nuclear power climbed with doubling of the ratio from 5% to 10% in 1980 until a decade later.
Linking Words
To sum up
, we could say that the ratios of the three sources: natural gas, coal are changing modestly Linking Words
while
the oil usage is dropping.Linking Words