
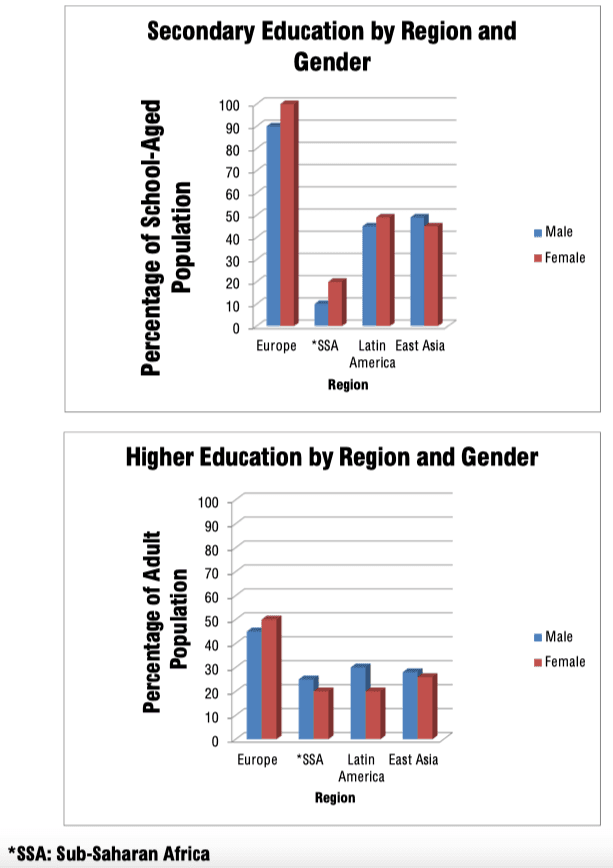
Given are
two column
graphs comparing the rates of secondary and tertiary Add a hyphen
two-column
education
among males and Use synonyms
females
in various different parts of the world.
Use synonyms
While
Europe enjoys relatively high levels of Linking Words
education
Use synonyms
overall
, it seems that people in less affluent regions are far less likely to be educated. All European girls of school age and 90 Linking Words
Use synonyms
percent
of boys receive Change the spelling
per cent
of
girls and 10 Change preposition
apply
Use synonyms
percent
of boys in Sub – Saharan Africa Latin. America and East Asia, meanwhile, have moderate levels of secondary Change the spelling
per cent
education
– between 40 and 50 Use synonyms
Use synonyms
percent
for both sexes.
With regard to higher Change the spelling
per cent
education
, the figures are much lower throughout the world. In Europe, some 50 Use synonyms
Use synonyms
percent
of adult Change the spelling
per cent
females
and 45 Use synonyms
Use synonyms
percent
of adult males gain a higher Change the spelling
per cent
education
.
Use synonyms
Conversely
, only 20 Linking Words
Use synonyms
percent
of Change the spelling
per cent
females
and 25 Use synonyms
Use synonyms
percent
of males in sub – Saharan Africa attend college or university. The figures for Latin America and East Asia are marginally higher than those Change the spelling
per cent
of
Africa.
Change preposition
for
Also
Linking Words
note worthy
is the fact that Correct your spelling
noteworthy
females
are more likely to receive Use synonyms
a
secondary Remove the article
apply
education
in all regions except East Asia, but less likely to receive Use synonyms
a
tertiary Remove the article
apply
education
in all regions except Europe.Use synonyms