The pie charts below show the online shopping sales for retail sectors in New Zealand in 2003 and 2013. Summarize the information by selecting and reporting the main features, and make comparisons where relevant.

The pie charts below show the online shopping sales for retail sectors in New Zealand in 2003 and 2013.

Summarize the information by selecting and reporting the main features, and make comparisons where relevant.
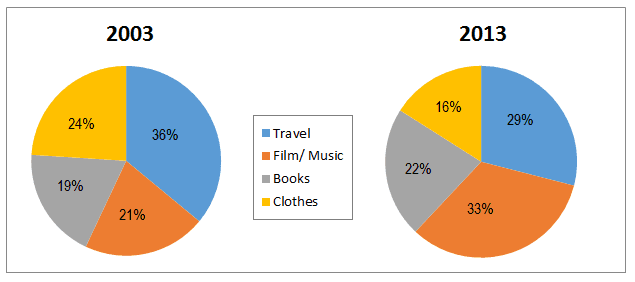
The pie graphs demonstrate changes in distance shopping for four different selling sectors in New Zealand during a decade from 2003.
Overall
,
while
the proportion of disposals for books and music with films went up, the number of clothes sold and travelling dipped marginally by the end.
Hence
, two features met a grow, and two others experienced a dip. As can be seen from the chart books accounted for the smallest part of sales in 2003, standing at 19%.
However
, these figures marked a minimal climb at 3% through 2013.
Likewise
, the amount for film/music selling which shot up by 12% over the ten-year period, rose steadily compared to 2003, when it used to be 21%. With regard to the falls, less travel spend was registered in 2013
in contrast
to 2003, reaching a low of 29% from 36%.
Similarly
, clothes, having ranked second in sales with 24% at the start, dropped approximately by half ten years.
Submitted by sadullaevajasmin18 on

Unauthorized use and/or duplication of this material without express and written permission from this site’s author and/or owner is strictly prohibited. Excerpts and links may be used, provided that full and clear credit is given to Writing9 with appropriate and specific direction to the original content.

Introduction: The introduction is missing.
Introduction: Change the first sentence in the introduction.
Introduction: The chart intro is missing.
Vocabulary: The word "dipped" was used 2 times.
Topic Vocabulary:
  • Retail sectors
  • Online shopping sales
  • Market share
  • E-commerce
  • Growth trend
  • Significant change/increase/decrease
  • Percentage points
  • Consumer behavior
  • Shopping patterns
  • Revenue
  • Electronic goods
  • Clothing and footwear
  • Health and beauty products
  • Digital downloading
  • Leisure and personal goods
  • Sector analysis
  • Year-over-year comparison
What to do next:
Look at other essays: