
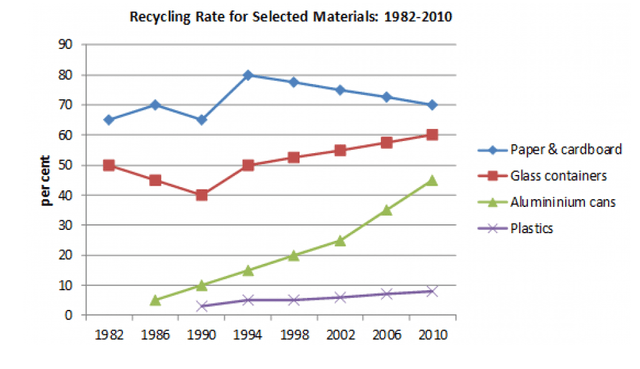
The graph shows the recycling of three different
type
of materials (paper and cardboard,glass containers,aluminium cans and plastics) over the period of 28 years from 1982 to 2010Change to a plural noun
types
..
Units are given in percentage.
From the Replace the punctuation
.
...
data
it is evident that among the recycled materials paper and cardboard stood at number one followed by glass containers.Plastics Add a comma
,data
has
the lowest percentage when comes to recycling.
About 65% of paper and Correct subject-verb agreement
have
cardboards
are reused after which Fix the agreement mistake
cardboard
ratio
slightly increases in 1986 and Correct article usage
the ratio
than
drops back to 65% in 1990.In 1994 Replace the word
then
the
recycling Correct article usage
apply
were
at its highest point which is 80%.After 1994 the ratio kept on declining and goes back to 70% in 2010 which was the same rate of 1986.
Glass containers Change the verb form
was
starts
off from 50% in 1982 and Change the verb form
start
goes
all the way up to 60% in 2010.The most significant dip occurs in 1990 Change the verb form
go
where
the percentage was 40.
Recycling of aluminium shows Correct word choice
when
gradual
increase Correct article usage
a gradual
through out
the period. After every two years the rate increases by 5%.It starts off from 0% in 1982 and stops Correct your spelling
throughout
on
45% in 2010. Plastics were the least reusable materials out of all.It remains Change preposition
at
between
the range of about 2% to nearly 10%.Change preposition
in