
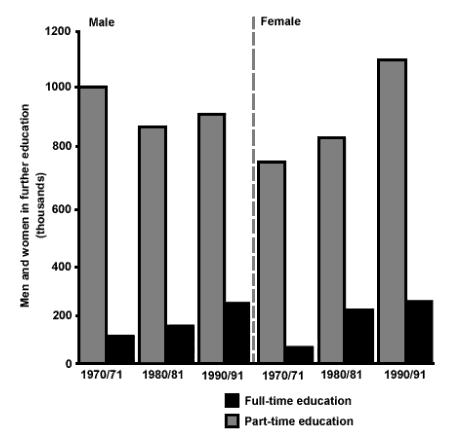
The diagram below features several bar plots that represent the sum of people pursuing higher education in the UK, based on several factors. These include their gender, which of the three decades included in the study were they a part of and whether the studies were full-time or part-time.
The first major, eye-catching, difference is that most students opted for part-time education, regardless of gender or the time period. Males enrolled in partial programs were
initially
more than their female counterparts, but their numbers dropped the next decade Linking Words
while
rising again by the end of the Linking Words
last
decade. Linking Words
In contrast
, female part-time enrollment showed a steady rise, eventually surpassing the men by the third decade. Linking Words
This
trend of increased participation can Linking Words
also
be observed by both genders in full-time programs.
To summarise, females made progress over males in terms of their involvement in full-time and part-time education in Britain for the given time periods.Linking Words