
5 5ytfhytrtty yrtyrty yrtj. treu tdotre tro re tuetuertruie tuiretweoooooooo vuetriu tuitepr uiriterslgtoi u8utl ruit utgidlguitie
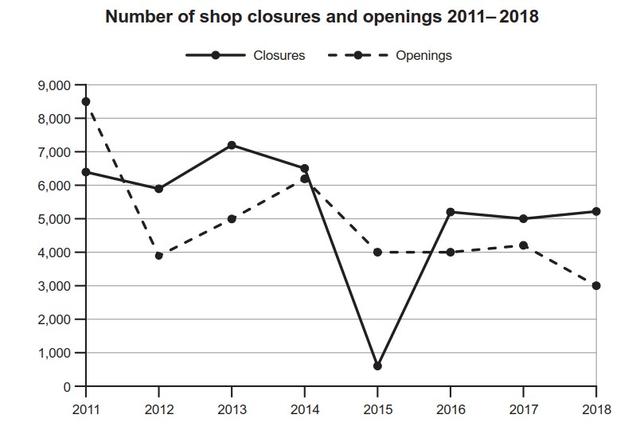
graph illustrates a comparison between the closure of shops and opening of new shops from 2011 to 2018.
✍️ Want to check your own essay?Write on this topic →
Unauthorized use and/or duplication of this material without express and written permission from this site's author and/or owner is strictly prohibited. Excerpts and links may be used, provided that full and clear credit is given to Writing9 with appropriate and specific direction to the original content.
Sentences: Add more complex sentences.
▼
Linking words: Add some linking words.
▼
Linking words: Add linking words.
▼
Introduction: The introduction is missing.
▼
Introduction: Change the first sentence in the introduction.
▼
Introduction: The chart intro is missing.
▼
Basic structure: Write more paragraphs.
▼
Basic structure: Add more body paragraphs.
▼
Common mistake: Your writing should be 150-250 words.
Basic structure: Change the first paragraph.
▼
Introduction: The chart intro is missing.
▼
Basic structure: Write more paragraphs.
▼
Vocabulary: Only 0 basic words for charts were used.
▼
Vocabulary: Use several vocabularies to present the data in the first paragraph.
▼