
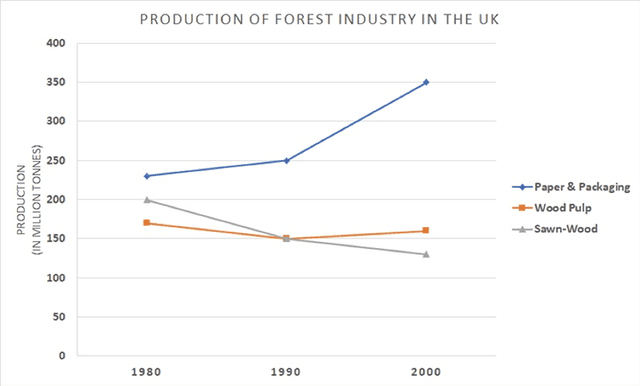
The line graph depicts how many
wood
-made-production are made in the UK between 1980 and 2000. The products are categorised into three; paper & packaging, Use synonyms
wood
pulps and sawn Use synonyms
wood
. The unit is a Use synonyms
million
-tone. Use synonyms
Overall
the paper & packing was the largest production throughout the given period.
The amount of paper & packing was about 275 Linking Words
million
Use synonyms
tonnes
in 1980. There was a slight increase to 250 in 10 years and reached the highest point at 350 Use synonyms
million
Use synonyms
tonnes
in 2000.
The sawn Use synonyms
wood
was the second largest amount of production in the first given period at 200 Use synonyms
million
tones, Use synonyms
while
the Linking Words
wood
pulp was at approximately 175 Use synonyms
million
tones. Both products dropped to 150 Use synonyms
million
Use synonyms
tonnes
in 1990. In the next 10 years, those products showed a different trend. The sawn Use synonyms
wood
slightly continued decreasing to 125 Use synonyms
million
tones. Use synonyms
On the other hand
, the Linking Words
wood
-plus rose to more than 150 Use synonyms
million
Use synonyms
tonnes
in the Use synonyms
last
period.Linking Words