
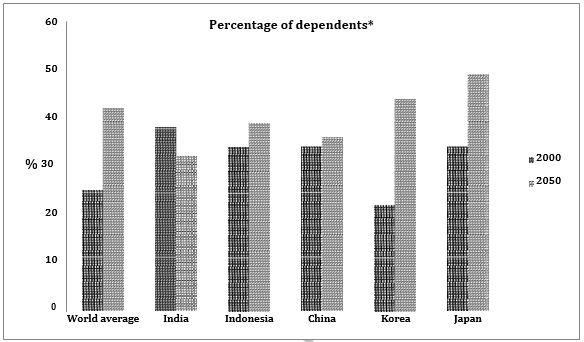
The bar graph given illustrates the proportions of dependents in five nations in the year 2000 and 2050,
as well as
the global mean. From an Linking Words
overall
perspective, it is forecasted that the number of dependents will experience an increasing trend, except for India.
In 2000, around 25% of the global population relied on other people for their daily needs and it is predicted that fifty years later, the number will rise to approximately 42%. Indonesia, China, and Japan Linking Words
initially
shared the same figure at 35%, more or less, at the beginning of the period. Linking Words
However
, based on prediction, the dependency rate will grow to roughly 39%, 35%, and 49% respectively for those three countries.
Linking Words
On the other hand
, Korea, which had the lowest dependency percentage at roughly 22% in the year 2000, will undergo a two-fold rise in the future. Linking Words
In contrast
, the opposite will happen to India. Almost 40% of Indians were not independent, but it is expected that the number will drop by around 8% in the year 2050.Linking Words