
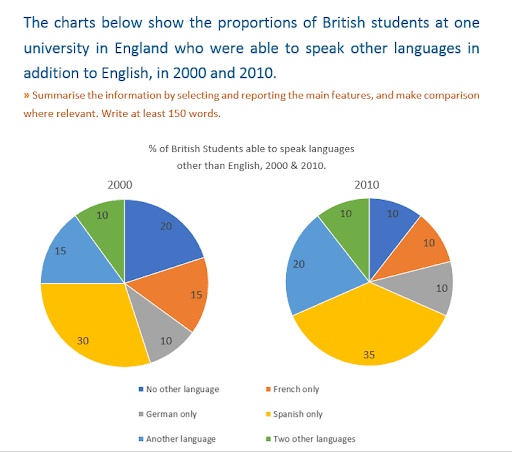
The pie chart compares data about British student who was able to speak different
languages
at the university of England in the Use synonyms
year
2000 and 2010.
Use synonyms
Overall
, The chart shows that Linking Words
students
were more interested in some Use synonyms
languages
and their interests gradually increase over the Use synonyms
years
. Use synonyms
However
, there are some similarities between the given time.
Linking Words
Firstly
, Let us look at those Linking Words
students
who were able to speak more. It is noticeable that for Use synonyms
both
Use synonyms
years
the Spanish Use synonyms
language
was the highest: 65%. If we see Use synonyms
according to
Linking Words
years
, it was 30% in the Use synonyms
year
2000 and 35% in 2010.Another Use synonyms
language
was the second most interesting Use synonyms
language
that Use synonyms
students
learned and Use synonyms
also
it was the second largest percentage for Linking Words
both
Use synonyms
years
.
Turning now to similarities and least interesting Use synonyms
languages
. Two other Use synonyms
languages
and German remained the same in Use synonyms
both
Use synonyms
years
. It was 10% with the least interest of Use synonyms
students
. Use synonyms
However
, no other Linking Words
language
and french Use synonyms
students
were good at learning in the Use synonyms
year
2000, but somehow in the Use synonyms
year
2010 they have shown less interest in Use synonyms
both
Use synonyms
languages
and it Use synonyms
also
faces a downward trend.Linking Words