
The
graph
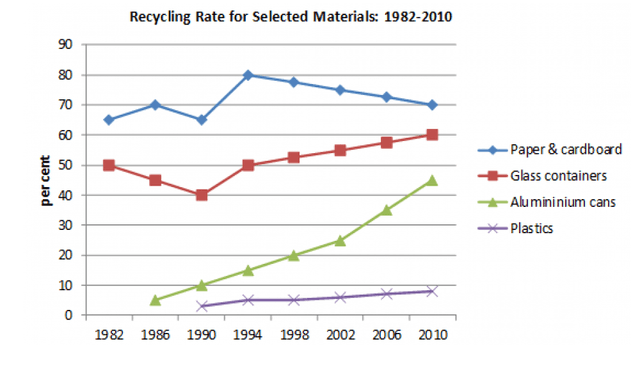
below illustrates the statistics( in percentages) of recycled Use synonyms
paper
and Use synonyms
cardboard
. Use synonyms
Glass
containers, aluminium cans, and plastic.
Use synonyms
Overall
, it is obvious from the Linking Words
graph
that the most recycled materials from 1982 to 2010 were Use synonyms
paper
/Use synonyms
cardboard
and Use synonyms
glass
containers. Use synonyms
On the other hand
, the least recycled material was plastic.
Looking closer at the Linking Words
graph
reveals that Use synonyms
paper
/ Use synonyms
cardboard
and Use synonyms
glass
containers were the most recycled materials in 1980 with the highest Use synonyms
rates
well over 65% and just over 50%. Use synonyms
However
, the Linking Words
rates
of recycling both experienced fluctuations over the given years. Use synonyms
Paper
recycling increased from 1982 and reached 70% in 1986. Use synonyms
However
, it fell back dramatically to well under 70% in 1990 and jumped again to 80% in 1996.From around 1996 to 2010 , Linking Words
paper
and Use synonyms
cardboard
recycling Use synonyms
rates
declined again and slowly fell back to 70% in 2010. Use synonyms
Rates
of recycling Use synonyms
glass
,Use synonyms
on the other hand
, experienced a significant decrease between 1992 and 1990, falling by 10% followed by a jump to 50% in 1995 after which it increased gradually over the following years reaching over 60% by 22010.
Another important trend shown in the Linking Words
graph
is the increase in Use synonyms
rates
of recycling aluminium recycling which Use synonyms
according to
the Linking Words
graph
only started in 1986 and from 1986 to 2010 it experienced a sharp rise, peaking in 2010 and reaching nearly 45%. Use synonyms
Rates
of recycling plastic Use synonyms
in contrast
Linking Words
,
remained the same from the year people started recycling it in 1990 and 2010, only increasing by 10 % over the years.Remove the comma
apply