
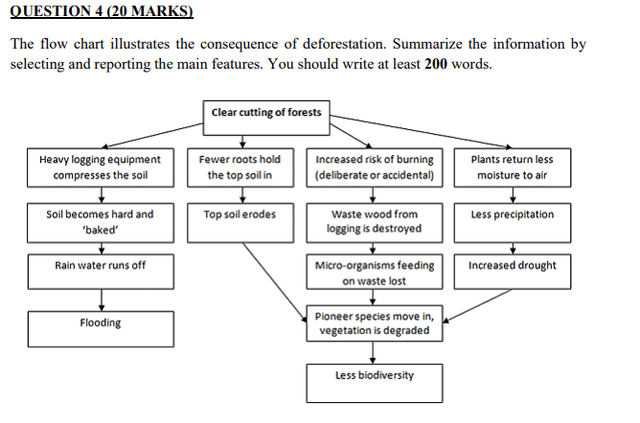
the flow chart below
demonstrate
the consequences of logging Change the verb form
demonstrates
of
trees on our society and biodiversity.
A Change preposition
apply
clear cutting
of forests Add a hyphen
clear-cutting
firstly
compresses the Linking Words
soil
Use synonyms
due to
the use of heavy logging equipment. once the Linking Words
soil
is compressed, it becomes hard and “baked” whilst rain waters Use synonyms
run off
leading to flooding.
Correct your spelling
runoff
Secondly
, Once trees are Linking Words
cutted
, Correct your spelling
cut
top
Correct your spelling
topsoil
soil
erodes as fewer roots hold the Use synonyms
top
Correct your spelling
topsoil
soil
in place, drought increases Use synonyms
due to
less precipitation as Linking Words
result
of plants returning less moisture to the air, Add an article
a result
micro-organisms
feeding on waste are lost Correct word choice
and micro-organisms
as a result
of the destruction of waste wood from logging Linking Words
due to
increasing of risk of deliberate or accidental burning. Because of those actions, pioneer species move in, vegetation is degraded Linking Words
so
many species are endangered Correct word choice
and
therefore
the biodiversity decreases.
In conclusion, logging of hardwoods led indirectly to flooding and loss of biodiversity.Linking Words