
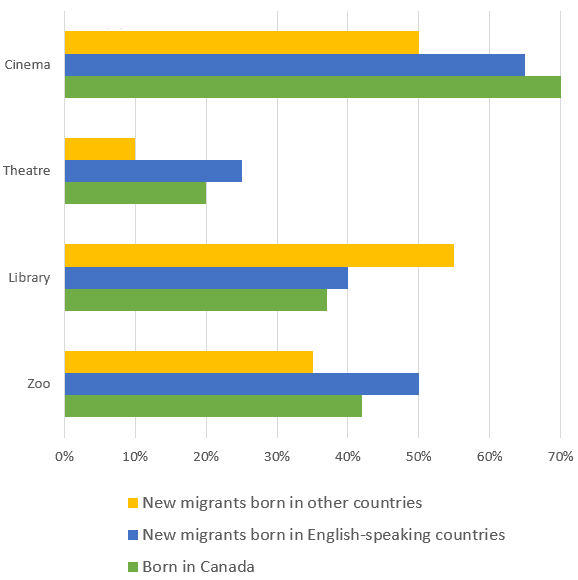
The bar chart indicates how three various
groups
of Canadian residents are in favour of the location of visiting.
Use synonyms
Overall
, it can be seen that Canadians generally are the favourite to go to cinemas. Linking Words
In contrast
, theatres are unable to attract citizens to come an effective way.
Linking Words
First,
in precise,there are 70% of local-born Canadians love to visit cinemas, Linking Words
along with
65% of new English-speaking Linking Words
migrants
and 50% of non-English-speaking Use synonyms
migrants
who are in favour of visiting there. Use synonyms
Second,
about 55% of people born in non-English-based countries are most likely to go to the library, Linking Words
while
approximately 40% of the other two Linking Words
groups
go there.
Zoo is Use synonyms
also
a popular location for 50% of the group of new Linking Words
migrants
speaking English. it cannot be ignored that there are over 40% of non-Use synonyms
migrants
and 35% of non-English-base Use synonyms
migrants
love to watch animals. Use synonyms
However
, theatre is the least fascinating place of all three Linking Words
groups
of people with only 10% of non-English-speaking Use synonyms
migrants
and almost a quarter of other Use synonyms
groups
who like to visit there.Use synonyms