
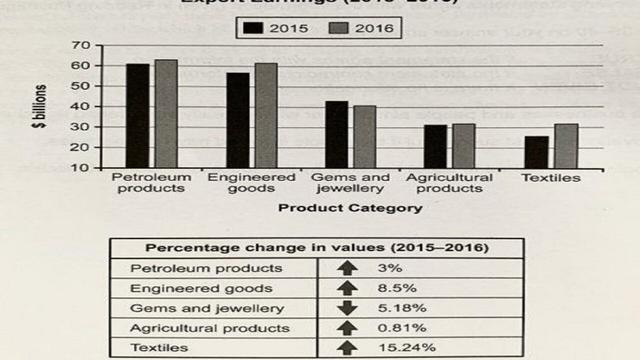
A glance at the column chart and table provided reveals the number of the country's exports by diverse items in 2015 and 2016 and the alteration in each item of exports between 2015 and 2016 by per
cent
.
Use synonyms
Overall
, in 2015, the highest income came from the export of Linking Words
petroleum
Use synonyms
products
, Use synonyms
while
the lowest was from Linking Words
textiles
. In the next year, Use synonyms
petroleum
Use synonyms
products
remained the top position, Use synonyms
whereas
earnings from Linking Words
textiles
and agricultural Use synonyms
products
were at the bottom. Use synonyms
Additionally
, textile exports experienced significant growth in 2016, Linking Words
while
export of gems and jewellery saw a moderate decline.
In detail, the export of Linking Words
petroleum
Use synonyms
products
was the highest, Use synonyms
while
Linking Words
textiles
were the lowest, accounting for approximately 60 and 25 Use synonyms
billion
Use synonyms
dollars
. In 2016, the amount of exported Use synonyms
petroleum
and engineered Use synonyms
products
were almost the same at around 61 Use synonyms
billion
Use synonyms
dollars
Use synonyms
as well as
income from Linking Words
textiles
and agricultural Use synonyms
products
were similar, making up 31 Use synonyms
billion
Use synonyms
dollars
. Use synonyms
In addition
, earnings from exporting gems and jewellery decreased in the latter year by 3 Linking Words
billion
Use synonyms
dollars
, accounting for 40 Use synonyms
billion
Use synonyms
dollars
.
Regarding the table, the amount of exported Use synonyms
textiles
experienced a considerable increase of 15.24 per Use synonyms
cent
in 2016 in comparison to the year 2015, Use synonyms
while
exported gems and jewellery decreased by 5.28 per Linking Words
cent
. Use synonyms
Moreover
, income from Linking Words
petroleum
Use synonyms
products
and agricultural Use synonyms
products
saw a mere growth, accounting for 3 per Use synonyms
cent
and 0.81 per Use synonyms
cent
respectively.Use synonyms