
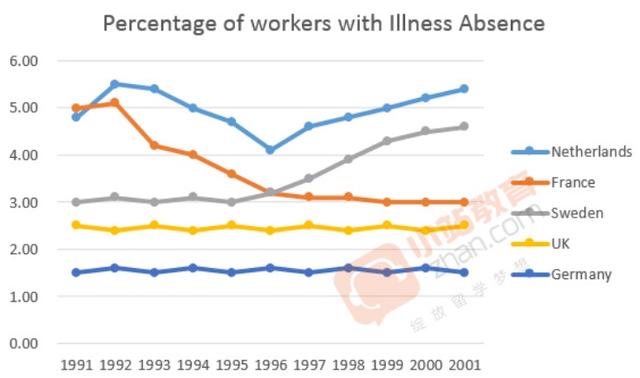
The line graph illustrates the proportion of employees from
Netherlands
, France, Sweden, Correct article usage
the Netherlands
UK
and Germany that had one or more day-off owing to sickness over a period of 10 years starting from 1991.
Correct article usage
the UK
Overall
, Linking Words
it is clear that
the percentage of Linking Words
Germany
Correct your spelling
German
laborers
with illness absence was the lowest, the opposite was true for the figure Change the spelling
labourers
of
Change preposition
for
Correct article usage
the Netherlands’
Netherlands’
over the period given.
In 1991, the percentage of off-workers who suffered from sickness in Change noun form
Netherlands
Netherlands
and France stood at approximately 5, which was nearly double higher than that in Sweden. In the next 5 years, the rate of Netherlands and France employees with diseases absence experienced a significant drop, with 4.2 for Correct article usage
the Netherlands
Netherlands
’ and 3.2 for Correct article usage
the Netherlands
France’s
in the year 1996. Change noun form
France
By contrast
, over that 5-year period, Sweden’s fluctuated slightly around 3 Linking Words
percents
. Since Correct your spelling
per cent
then
, the percentage of Linking Words
Sweden
and Netherlands’ day-off workers Change noun form
Sweden's
due to
illness substantially climbed, Linking Words
stabilised
at 4.8 and 5.2 respectively, Wrong verb form
stabilising
while
the rate of France’s remained unchanged over the next 5-year time.
Looking at other features, the rate of off-work Linking Words
labores
because of diseases in Correct your spelling
labourers
UK
and Germany reached approximately 2% in 1991, which Correct article usage
the UK
were
the smallest Correct subject-verb agreement
was
percentages
among all rates given. Over the time shown, these two proportions saw a minimal fluctuation, Fix the agreement mistake
percentage
then
levelled off at 2.4 and 1.9 respectively in the end.Linking Words