
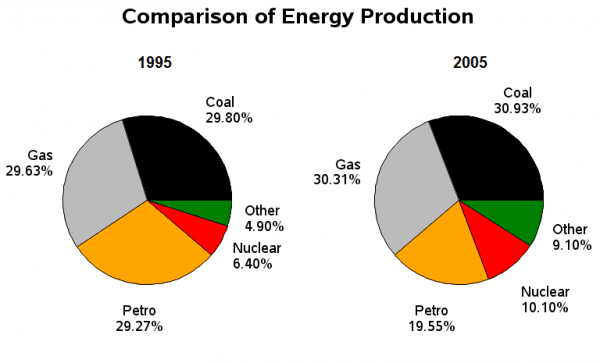
The given pie graphs elucidate diverse sorts of
energy
Use synonyms
production
in France in 1995 and 2005Use synonyms
,
and illustrate the different quotas for five types of Remove the comma
apply
energy
, including gas, coal, petrol, nuclear, and others.
In general, coal was continuously the main output; meanwhile, with the decrease in the proportion of petro, all other four categories of Use synonyms
energy
Use synonyms
production
went upward throughout the period.
Looking into details, the largest amount of Use synonyms
energy
Use synonyms
production
in 1985 was coal, accounting for 29.80%, followed by gas (29.63%) and petroleum (29.27%) with narrow differences. Use synonyms
In addition
, nuclear Linking Words
energy
merely contributed to 6.40% of the whole yield, and other resources made up 4.90%.
Turning to Use synonyms
further
details, it can be seen that coal was still the dominant Linking Words
energy
-producing industry in 2005, with a slight increase of 1.13% in comparison to 1995. Use synonyms
Likewise
, the Linking Words
production
volume of gas kept a high level, representing 30.31% of the whole Use synonyms
energy
generation in 2015. Use synonyms
However
, there was a noticeable reduction in petro Linking Words
production
, from 29.27% to 19.55%, which means the Use synonyms
production
of petro was curtailed to 3 in 5 as the previous proportion. On top of that, the generation of both nuclear and other Use synonyms
energy
grew in 1995, the former touched 10.10% and the latter reached 9.10%.Use synonyms