
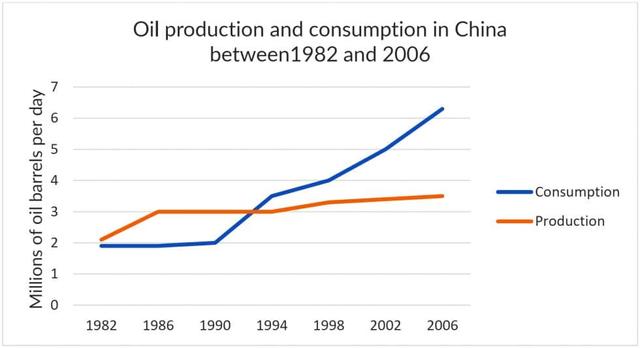
This
chart shows the Linking Words
production
and consumption per day using Use synonyms
oil
in China from 1982 to 2006.
Use synonyms
Overall
, before 1993, Linking Words
oil
Use synonyms
production
was more the Use synonyms
oil
consumption and it was suppressed after 1993. Between 1982 and 1990, there were no changes in the use of Use synonyms
oil
remaining 2 Use synonyms
million
. it significantly increased after 1990 and peaked at 6.2 Use synonyms
million
in 2006. Use synonyms
In contrast
, the Linking Words
production
of Use synonyms
oil
remainedUse synonyms
3
Change preposition
at 3
million
from 1986 to 1994.
Looking at the graph more closely, Use synonyms
it is clear that
the use of Linking Words
oil
was nearly 2 Use synonyms
million
in 1982 and it doubled in 1998 reaching 4milion. Use synonyms
Furthermore
, it more than tripled in 2006. The Linking Words
oil
Use synonyms
production
was Use synonyms
also
approximately 2 Linking Words
million
in 1982. Use synonyms
However
, there are slight changes from 1993 to 2006 and,Linking Words
eventually
it did not suppress Add a comma
,eventually
oil
consumption. The Use synonyms
production
of Use synonyms
oil
was more than 3 Use synonyms
million
in 2006 and Use synonyms
this
figure doubled the use of Linking Words
oil
in the same period.Use synonyms