
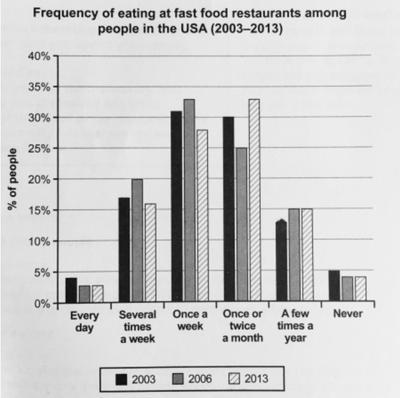
The bar chart provides information about the percentage of
the
Correct article usage
apply
people
in the USA in fast Use synonyms
food
restaurants in 2003, 2006, and 2013.
Use synonyms
Overall
, Linking Words
although
the number of Linking Words
people
having their Use synonyms
food
at fast Use synonyms
food
restaurants once per week was significant in 2003 and 2006, it was replaced by a group representing Use synonyms
people
who ate there either one or two times a month in 2013. Use synonyms
Furthermore
, the lowest percentage was reached by Linking Words
people
eating there on a daily basis.
Around 5% of Use synonyms
people
ate fast Use synonyms
food
Use synonyms
everyday
in 2003. Replace the word
every day
However
, it dropped a year after, fluctuations are there in the category of Linking Words
people
who ate several times a week. It can be seen that there was a decrease in the number of Use synonyms
people
who ate once Use synonyms
in
a week from about 33% in 2006 to around 27% in 2013. Change preposition
apply
While
during the same time Linking Words
period
there was a surge in the category of Add a comma
,period
people
who ate once or twice a month. Use synonyms
However
, the proportion was fairly constant in 2003 for these categories.
Looking at the lower percentage groups, Linking Words
people
who eat rarely in a year was about 13% in 2003, which increased to 15% in 2006 and remained the same in 2013. Use synonyms
People
who have never been to fast Use synonyms
food
restaurants fall below 5% in the Use synonyms
overall
given time period.Linking Words